My first idea also that its some cleanup of ports, fdb or something, but strange that it only effect on dispatcher service polling and invisible for old crontab polling.
I also faced this issue and there have daily gap from 08:00 am to 08:40 am.
I’ve checked disk i/o and CPU utilization, and there have some strange status.
-
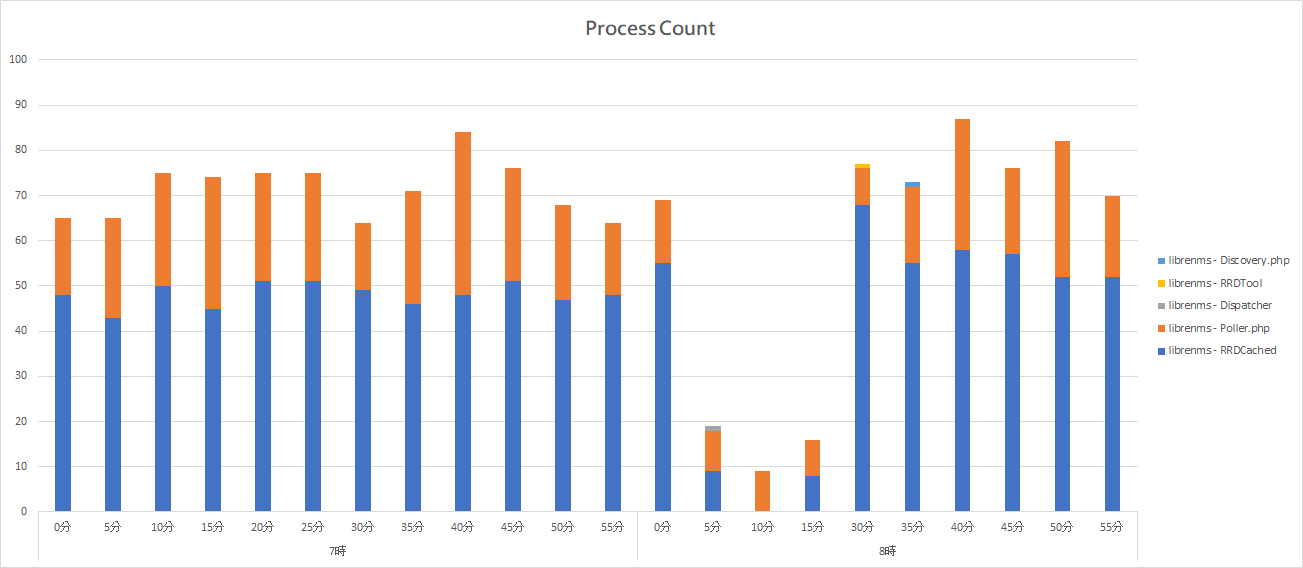
Utilization of RRDCached service getting lower in this period, and the process counter reduce from 50 times per minute to 10 times per minute.
-
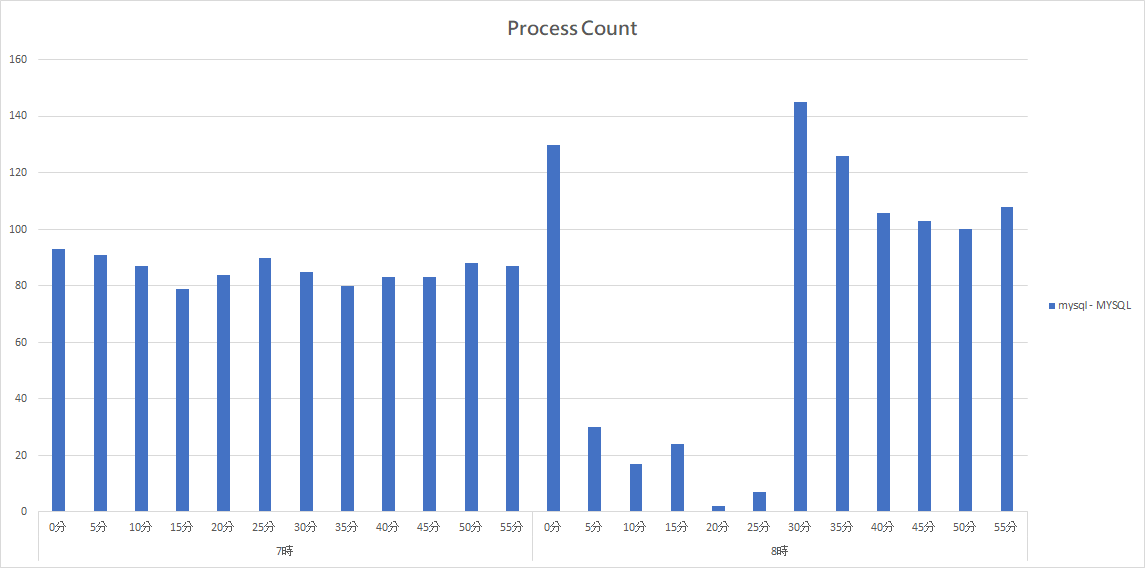
Utilization of MYSQL also getting lower in this period, and the process counter reduce from 90 times per minute to 10-20 times per minute.
-
Disk write speed reduce from 30MB/s to 5MB/s in this period.
-
CPU idle percentage increase from 30% to 98% in this period.
I only monitor around 200 devices on it, and I use VM instead of appliance server.
Is there have any way to find out root cause on this issue?
Are you backing up the VM at that hour by casuality?
No, I’ve checked with VM admin, and there is no regular snapshot or backup activity in this period, and the resource on host is under 50%, so it should not be the issue on virtualization.
I also checked process status for librenms and mysql account, and the RRDCached status is getting lower than other time.
May I know how to check why this happen?
I made distributed dispatcher service setup with added couple more pollers - daily gap only on master poller.
Now i suspect it maybe connected to peeringdb caching as it seems longest daily task, i will try to disable it and check again.
May I know did you solved this issue?
Nope, only was able somehow move gaps to other than master poller, so it is possible to limit affected hosts, but can’t catch yet what steps exactly did that.
I’ve proposed a change that should resolve the gaps in polling at around midnight UTC for users of the dispatcher service.
If you’re affected, it’d be useful to know what your longest discovery job is (look in the devices DB table, last_discovered_timetaken), and if the change works for you.
2 Likes
We are affected. We have 4 devices that take a long time to pull. They are Cisco switches all of the same make and model. 2 of them take 1.5 hours and the other 2 take 3.5 hours (each set of switches are in a different datacenter). LibreNMS version 1.66. Turning off the discovery process in the dispatcher doesn’t solve our problem either. The LibreNMS service still does discovery throughout the day and if one of these switches is discovered at 11pm (or any time before midnight and the time it takes to finish), graphs will stop at midnight until the discovery is completed.
Same here for us, using the dispatcher and version 1.66. anyone has a workaround?
You can use Work In Progress PR from @TheMysteriousX, check couple post above, i tested it couple months ago it was working good, gaps vanished. Will also test current version and report.