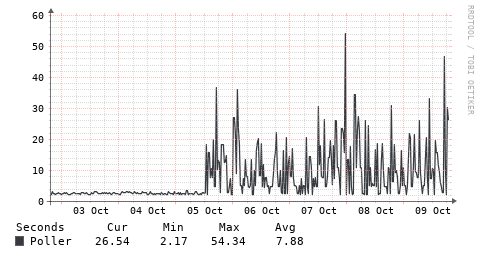
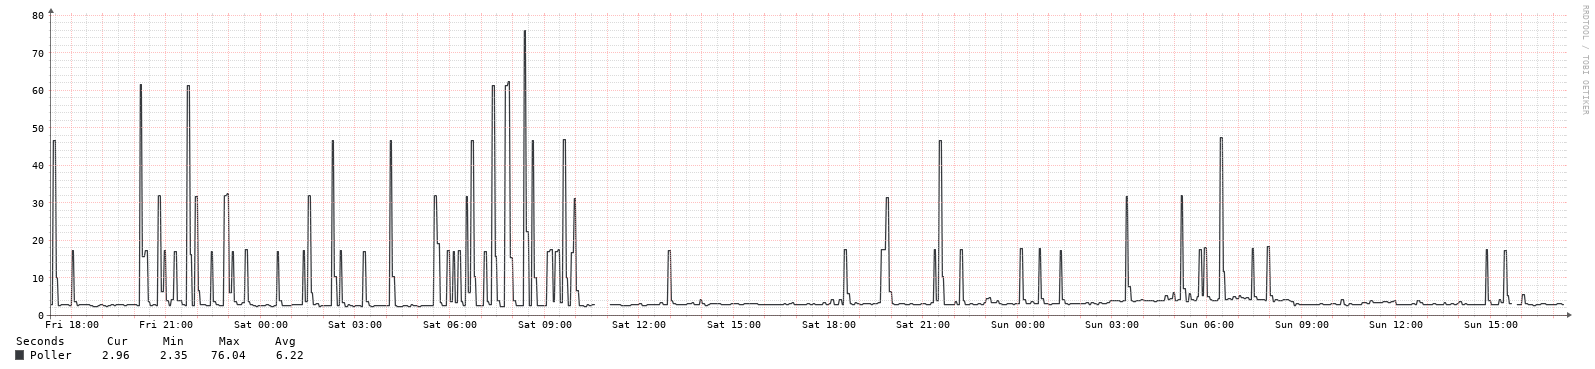
I know some other items can impact this, but in case others have seen this - an interesting change in polling times recently (plot below). And the client is running the same firmware that has been in it for a VERY long time (i.e. year or two, no updates at all).
Happened on several devices, but not all. Of course LibreNMS is being updated (daily), and underlying Linux machine every so often. So it can be either - any thoughts how to debug?
If you want to get crazy you can record debug info for all polls to log files. These will include times for modules and queries. Just add -d to the wrapper in your cron.
I was able to capture a case where the response was very slow (~ 1 min). It seems to be related to the ports module (i.e. I limited to -m ports). Is there a good place to store the log (i.e. a LibreNMS preferred Pastebin?)?
Yes, very odd. I worked through it (I think, fingers crossed yet … ;-)). I did a few things,
Pulled LibreNMS code from before the shift in performance. Made no difference
Manually executed the commands that were being sent => found that snmpbulkwalk was causing the issue, so,
Temporarily disabled bulk walk for this OK - seems to work (so far)! Odd that something triggered this (Linux change?) … as the OS on the box hasn’t changed in a VERY long time. But let’s see. If this sticks, I’ll submit a PR for it.
BTW, it would be handy in the debug output to show (in text) the actual (full) snmp command that is executed - just to make sure when manually trying things the command is exactly right. Just a thought.
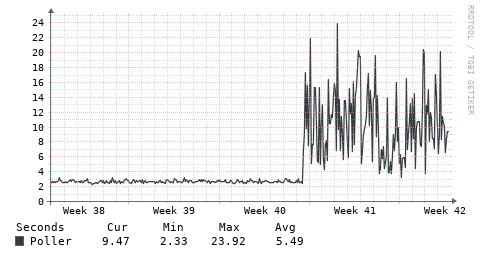
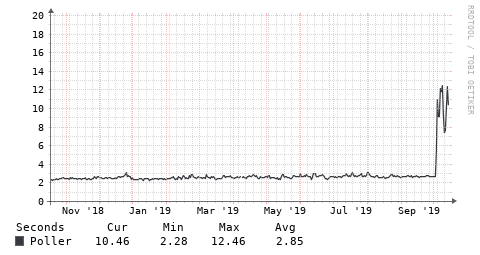
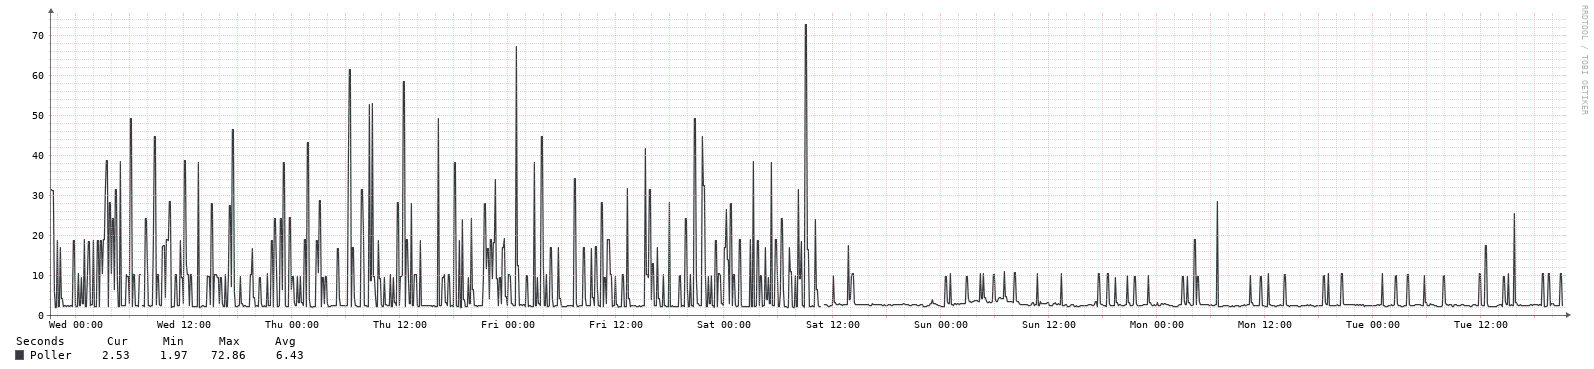
OK, definitely better, but not 100% fixed - plots below from 2 Tomato boxes. Is there a way to have the debug output show timing for each snmp command, not just after “groups” of them? Just to get to the bottom of what is causing this. Thanks!
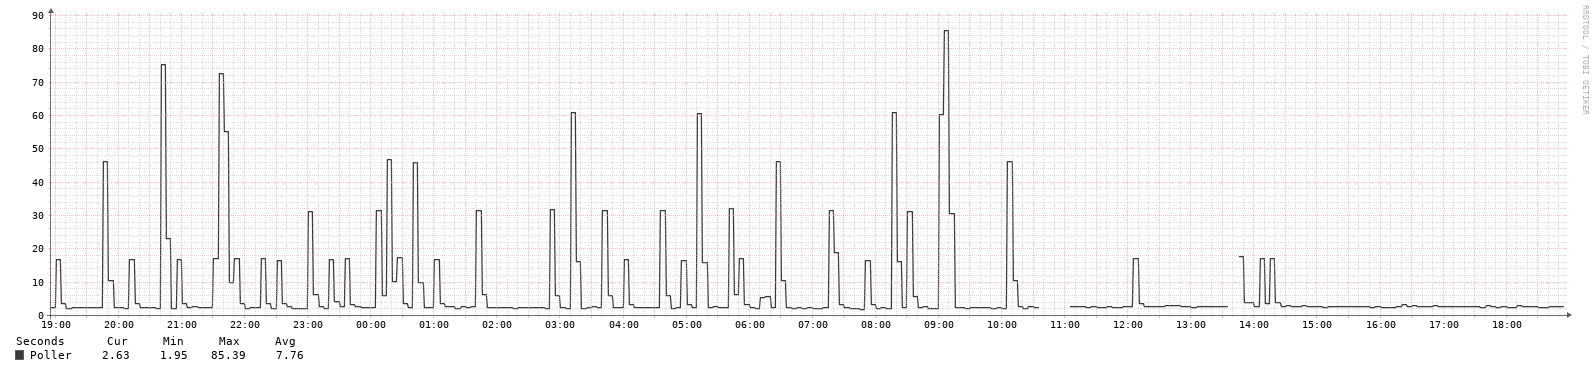
Latest update - here is the status after moving to nobulk … clearly a big help. Will submit that, but want to get to the bottom of the remainder, submit the full fix all at once.
Ok, bulk seems to help, but the remainder is a bit of a mystery to me yet … . I tested a couple commands in a loop, results as below,
/usr/bin/time -f “%e” sudo -u librenms /opt/librenms/poller.php -h wap-patio -r -v
=> Yep, this one breaks … runs for a while, few seconds each time, but then will jump up to ~ 15-20 sec (and “fail”, given I have a threshold at 15 sec). So then,
/usr/bin/time -f “%e” snmpwalk -v 2c -c public wap-patio
=> Can run this one for hours, always ~ 1.5-2 sec. So even though the poller.php log is pointing at SNMP, it seems not to be at least snmpwalk (of the entire snmp output).
And agreed, I can easily add in the snmp commands - that’s actually why I was asking if there are output to the logfile somehow (to copy the exactly). You say to record them … is there an easy way to do that?
Well, that was “fun” … LOL. Found it! It was a combination of needing to add nobulk (submitting a PR for that right now), and after that - it seems that if timeout or retries is set, randomly this seems to trigger for items that aren’t in the OID table => remove those, and timing is all clean.