Grafana and Services

Hi

I have 10 services that I monitor externally with a TCP check via nagios plugins I have then attached these 10 services to the local host.

When I try to create grafana graphs for these services they do not appear to have any value.

When I check influxdb for them they dont not appear when executing the following command

select * from services

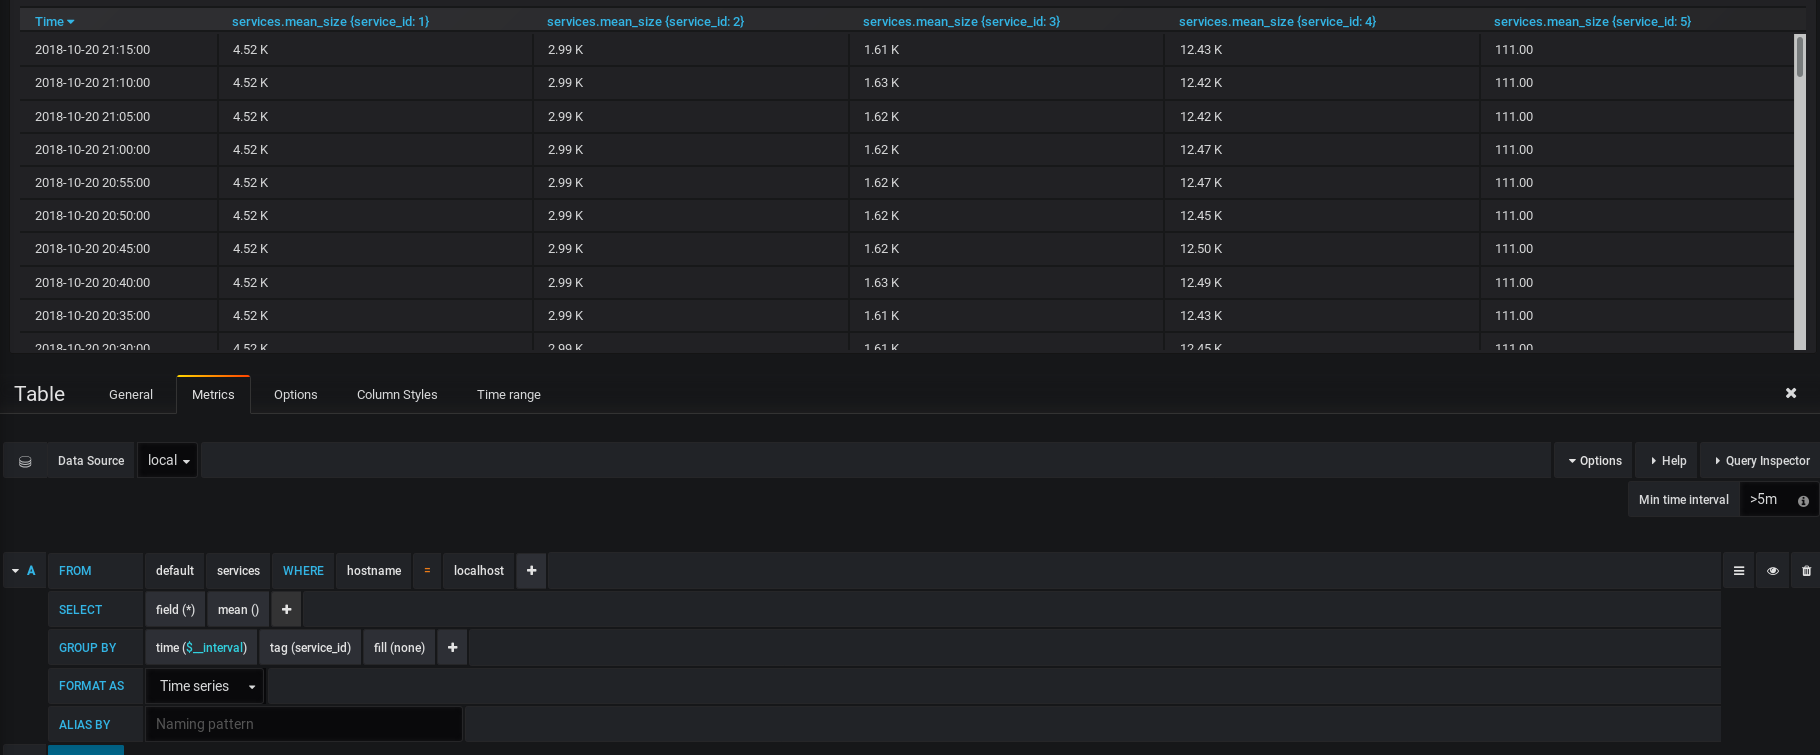
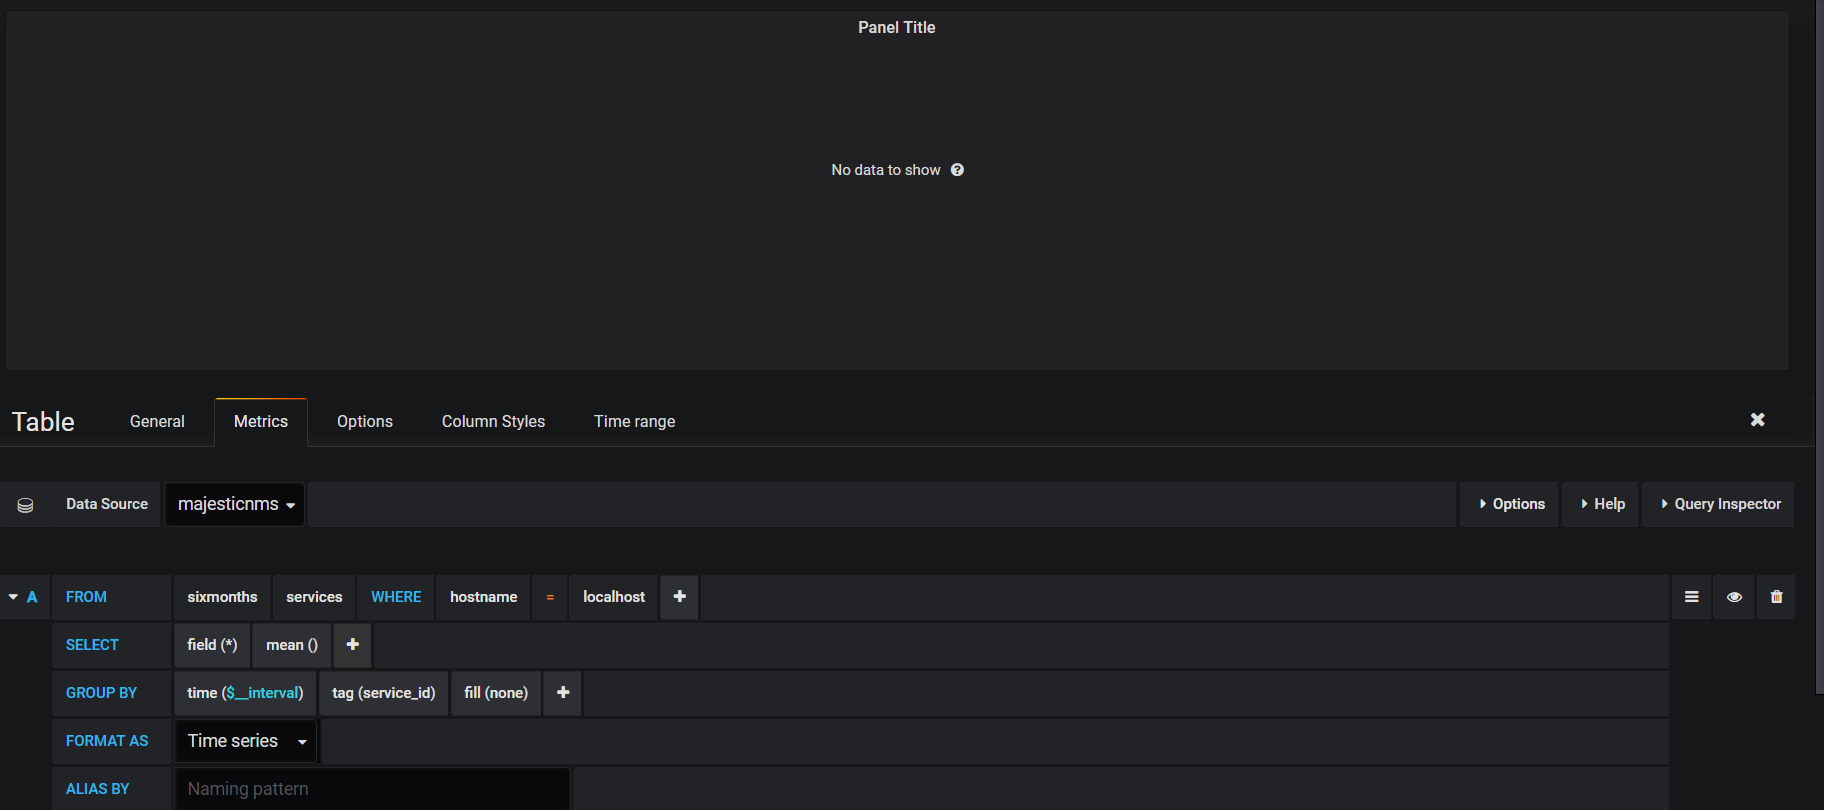
What does work is if a device has a single service attached to it then I can see the value. If a device has multiple services attached to it, the values do not appear in influxdb.

In Grafana try grouping by the service_id tag.

Hi

I tried that there is no data points.

Thanks

I canā€™t seem to duplicate. Hereā€™s what Iā€™m seeing with 5 check_http services on localhost.

Fill and interval may be in issue. It should line up with your polling interval. Iā€™m using the default 5m here.

Hi

Below are the services im a monitoring which are external and not services on localhost itself

This is my Grafana query

Question should I see entries in the influxdb for the above services when I check influxdb i dont see any entries

select * from services where (ā€œhostnameā€ = ā€˜localhostā€™)

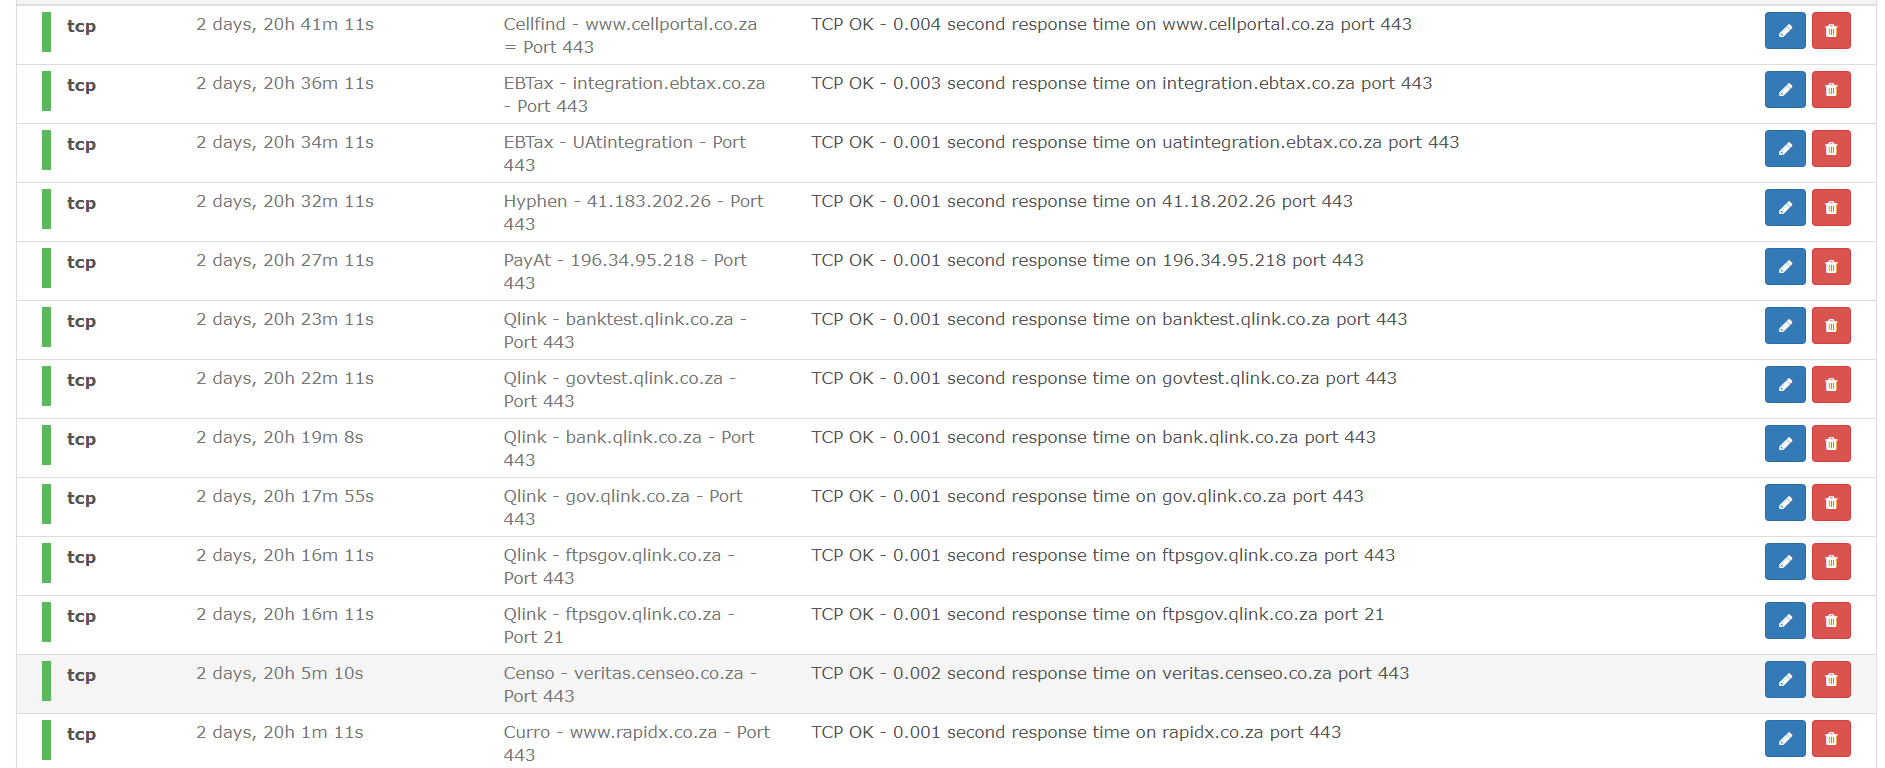
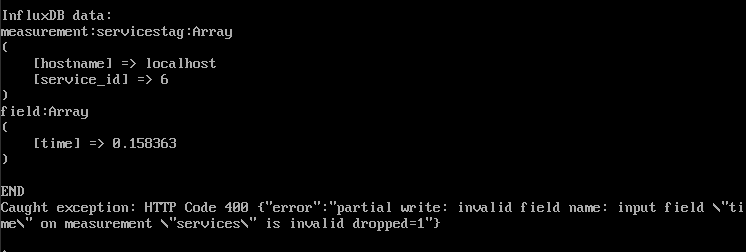
Cool, that helps. I think the difference is Iā€™m getting a byte count back from my check_http checks where check_tcp only gives you response time. If you runā€¦
/opt/librenms/check-services.php -h 1 -d -v

(change -h to whatever device # your localhost is in LibreNMS)
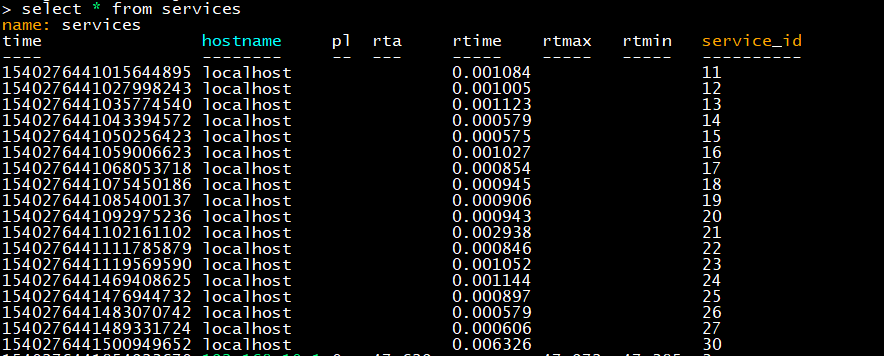
ā€¦as librenms user I think youā€™ll see an error from InfluxDB that time is not a valid field name. I did quick kludge to ./includes/influxdb.inc.php that changes field key time to rtime and that writes successfully. It looks like @laf wrote the influxdb code so maybe he can weight in on if thatā€™s a valid fix I can PR or if thereā€™s a better way to handle it.

Youā€™d need to show me a diff @slashdoom

Thanks slashā€¦

A side question, have you come across smokeping metrics?

Do they get exported to influx DB so they can be graphed by Grafan.

I canā€™t seem to find them.

Thanks

Not by librenms as we donā€™t do any generation of data for smokeping, smokeping would need to do that.

Thanks, @laf.

Error beforeā€¦

Hi Laf

I came across the following article.

https://hveem.no/visualizing-latency-variance-with-grafana

not sure is this can be implemented into librenms

@slashdoom Seems an ok fix. Submit the PR :slight_smile:

1 Like

Done. :+1:
https://github.com/librenms/librenms/pull/9358

Hi slashdoom

i am seeing this now influxdb

Thanks

1 Like