Help improving polling-time Mikrotik-CCR 1240 ports

So, i have this mikrotik CCR that serves 1240 Vlans (that are counted and reported as ports)…

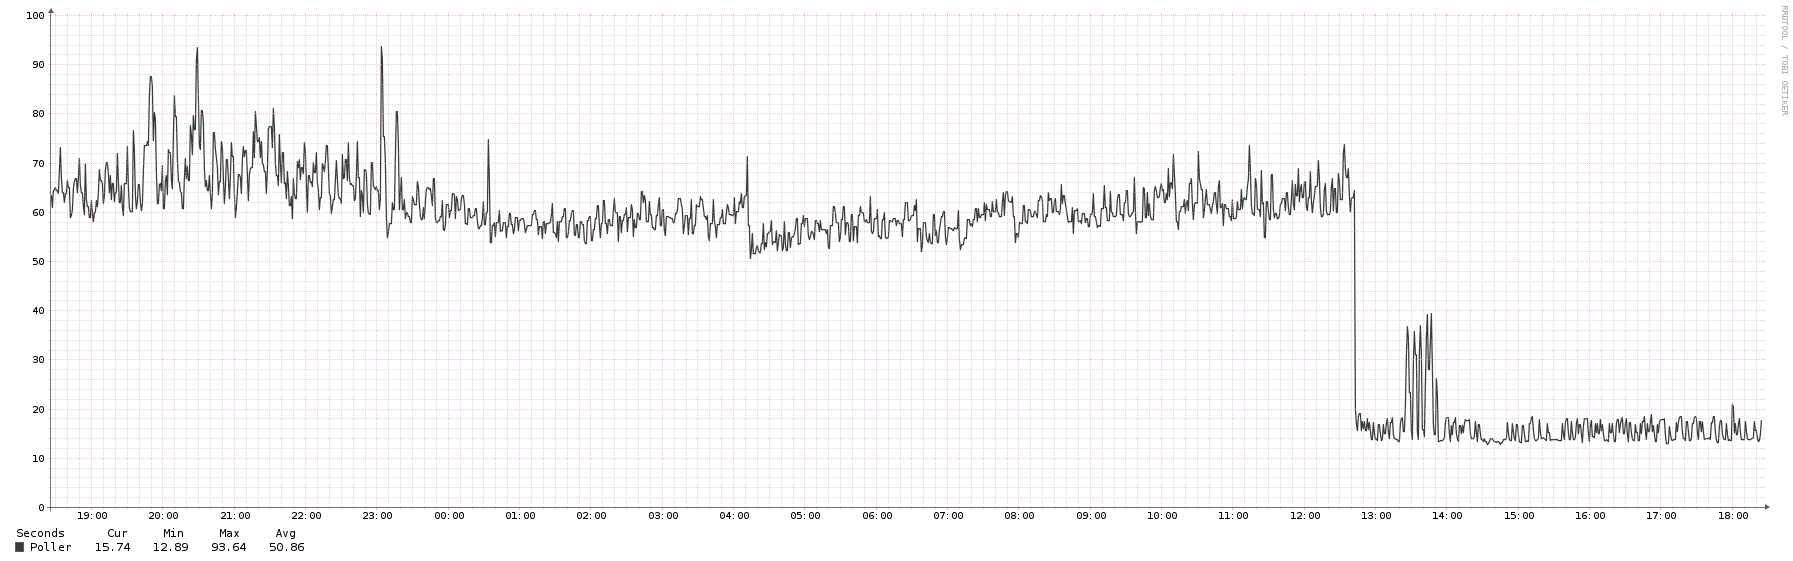
As ports were added, the polling times went from 40 to 73 seconds, and as i have 1 minute polling, i went to try some of the recommended optimizations.

of note: this LibreNMS installation has -the one- device, this mikrotik CCR, that is plugged directly in the librenms box via ethernet. That’s the only thing it has to monitor (and 127.0.0.1, but it polls in 1/2 a second…)

i tried the max_repeaters command line, and a value of 40 finishes in about 7-8 seconds
(10 takes 40 seconds, 25 finishes in 17 seconds.)

i then tried setting Max_Repeaters to 40 both via web (device-specific), and in config.php (globally), but the actual polling times did not change at all.

per-port-polling was enabled, so i then ran the optimization script with “-e 50” argument, and the script found that full-polling finishes in 13 seconds, vs 84 for per-port, so it automagically un-set that parameter, but still, no change at-all in the polling-time graph.

I tried rebooting the centos VM between both config changes, gave them a few hours to gather some poll-cycles, but no dice.

i’m lost as to why whatever i do to the configs, the polling times stay the same. all help appreciated.

Look at the poller module graph, it will tell you which module is taking the most, start with that.

It’s the “ports” module.

The divergence is that when i run the port-polling via command-line, it finishes in less than 20 seconds, but the polling run by the system takes 80 seconds !?

full-port polling with max_repeaters of 40 managed to get the time via cli down from 73 to 13 seconds, but setting the parameter made no difference in the graphs(and therefore times).

============edit to put in some data==============
[root@200-librenms]# ./scripts/collect-port-polling.php
Full Polling: 1 2
Selective Polling: 1 2

| device_id | os | port_count | inactive_ratio | full_time | selective_time | diff | diff | set |
| 1 | linux | 2 | 0.000 | 0.197s | 0.107s | -0.090s | -46% | none |
| 2 | routeros | 1240 | 0.266 | 14.537s | 62.080s | +47.544s | +327% | none |
| Totals: | | 1242 | 0.133 | 14.734s | 62.188s | +47.454s | +322% | 0 |
[root@200-librenms]#

i tried looking into the debug capture page, and dissecting the output i get the command line executed for the poll-ports module that takes almost all of the time:{

Load poller module ports

Caching Oids: SNMP[/usr/bin/snmpwalk -v2c -c COMMUNITY -OQUs -m IF-MIB -M /opt/librenms/mibs:/opt/librenms/mibs/mikrotik -t 40 -r 1 udp:HOSTNAME:161 ifXEntry]

Runtime for poller module ‘ports’: 98.0289 seconds with 42832 bytes
SNMP: [14/95.33s] MySQL: [2483/1.14s] RRD: [0/0.00s]

Unload poller module ports

}

executing this exact line via SSH with -CTt argument appended(and communuty/hostname correctly set) yields: “Total traversal time = 44.857351 seconds”

so that is already 50% faster just by being called manually which is weird.

By changing snmpwalk to bulkwalk (now timing with “time” command) i get “0m9.762s”
-Cr10 finishes in 8 seconds
-Cr30 finishes in 6 seconds
-Cr50 finishes in 5 seconds

Now, i am really unsure as what to do.
I set the Max_Repeaters in the web page for this device, but it appears not to be taken into account when generating the actual polling command line

The setup could benefit from using bulkwalk instead of straight walk, but it appears there is no standard way to change that.

i’m running the latest version 1.40-something, paired with php71 and centos.

what do i do?

nobulk is set for this OS and has been since the fork.

I don’t know why but you can test with this config: $config['os']['routeros']['nobulk'] = 0;

AHA!

That was it!

on a sidenote, since this is a 16core device, and it does nothing beside vlan-tag/untag, i decided it was “ok” that snmp filled two of those cores perpetually.

When i set the nobulk=0 for routeros, not only the polling time went from 70-ish seconds to 15-ish, but CPU usage dropped quite a lot aswell.

Thank-you!

I do wonder if we should change this as the default but I don’t know the reason why it’s been in place. It’s been like that for 5+ years though

I’ve been checking the graphs, and everything appears to being correctly polled.

there have been some recent SNMP related fixes in the Mikrotik changelog :

*) snmp - fixed “ifHighSpeed” value of VLAN, VRRP and Bonding interfaces;
*) snmp - fixed bridge host requests on devices with multiple bridge interfaces;
*) snmp - fixed bulk requests when non-repeaters are used;
*) snmp - fixed consecutive OID bulk get from the same table;
*) snmp - show only available OIDs under “/system health print oid”;

this is for ROS v6.41, released 22/12/2017.

if you search for the “snmp” occurrences there it becomes clear that bulkwalk was broken until quite recently.

I will test this with some other platforms, (namelly Routeros on ar71xx) that may be cpu-starved, and report back what i find.

I think given the huge performance improvement seen here, both in Librenms performance, and CPU impact in the polled device, that looking further into default to bulkwalk may prove fruitfull.

I had to hunt down some older hardware in my network so i could test this, and found 7 (out of 2000-ish) that are the oldest architecture mikrotik still supports (RB433 with ar7100 processor @300mhz )

running firmwares:
v6.40.3 (september 1st 2017) - predates some SNMP related changes in their changelog
v6.41.4(december 22nd 2017) - contains some SNMP related fixes
v6.42.3(may 24th 2018) - the latest version of their OS.

these boards are 2007 hardware, now superseded by much more powerfull/modern offerings, so i tought if some hardware running RouterOS would fail / experience high CPU usage due to SNMP, or anything like that, it would be these ones.

I added them to the librenms instance modified with “nobulk”=0, and 1 minute polling.

much to my surprise there is almost no impact in CPU usage, with polling times in the order of 6 seconds, and no noticeable CPU usage in the graphs. (via consola monitor, i see a 6% cpu usage on an idle board if i force the polling command).

they’ve been polling for a week and show no signs of ill effects or graphing inconsistencies due to bulkwalking.

I think it is a good bet to enable it by default like i understand LibreNMS does for most other platforms.

RouterOS has been heavilly modified in the last 5 years, so i think any bugs related to bulkwalking must have been solved a long time ago.

I also tried “Diff-ing” the outputs of walk and bulkwalk, to see if the number of polled parameters changed, and both modes reported 132 parameters. So i’m highly confident that bulkwalking is stable, and can be a big help to others like me who needed to optimize monitoring for RouterOS.
My opinion is that there is no downside to bulkwalking on RouterOS platform.

Please feel free to ask for any further info i could provide to facilitate a decision by the developers.

Cheers! and thanks for the great work!

Works for me. Thanks for spending the time in looking into this:

1 Like