Hi!
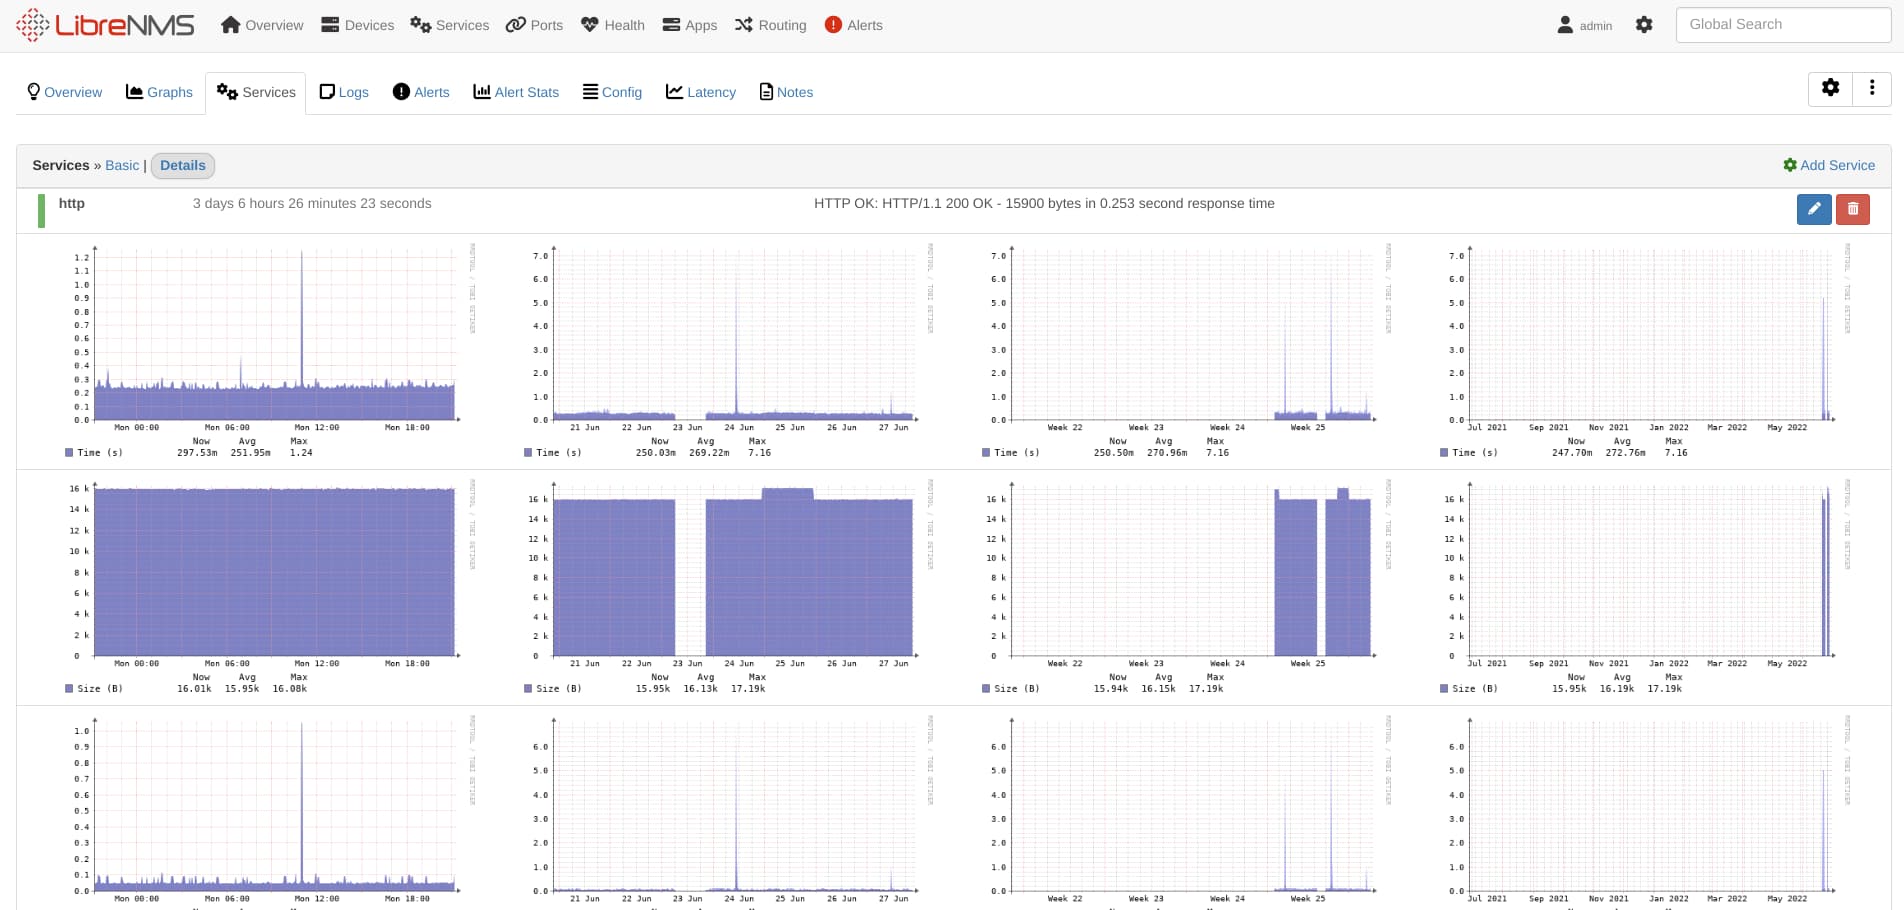
I’ve setup monitoring using the nagios http_check plugin, does LibreNMS log the displayed response time in the output from the plugin?
Even better if LibreNMS could plot it in the graphs for the device! 
Hi!
I’ve setup monitoring using the nagios http_check plugin, does LibreNMS log the displayed response time in the output from the plugin?
Even better if LibreNMS could plot it in the graphs for the device!
Interesting, my details tab shows nothing at all 
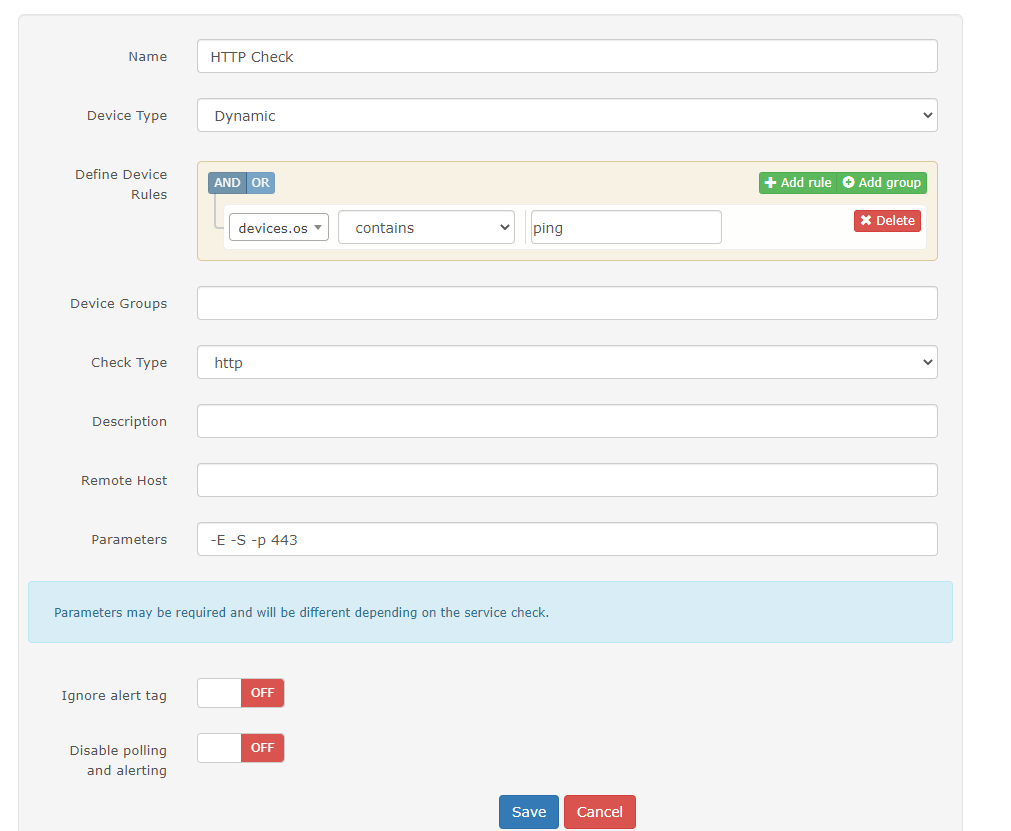
Hmm, what is your service parameters then? -E should be included as well as far as I know.
-S for SSL and -p is for port.
You can follow this guide, which helped me setup my HTTP service as well as SSL Certificate Checker service: Service checks in LibreNMS (http, all other Nagios plugins) - Raymii.org
Nevermind! Turns out it just needed some time to do the statistics. The other service i had was checking for SSL certificate expiration, which apparantly doesn’t generate the details tab
Thanks for your help!
This topic was automatically closed 7 days after the last reply. New replies are no longer allowed.