I notice the server stats widget have overlapping and duplication after I submit the update.
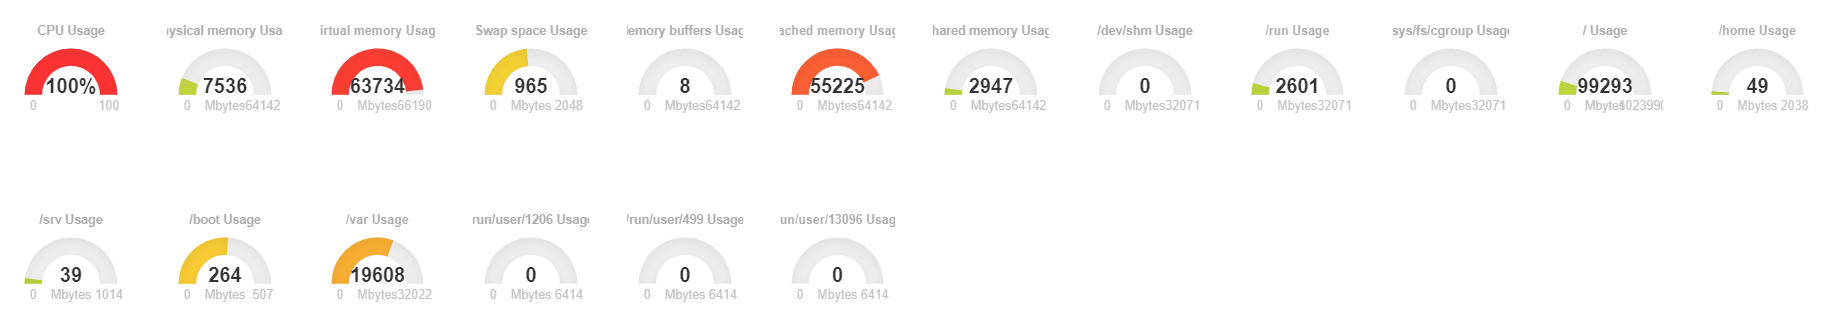
If I enter edit mode, then the widget display with correct status
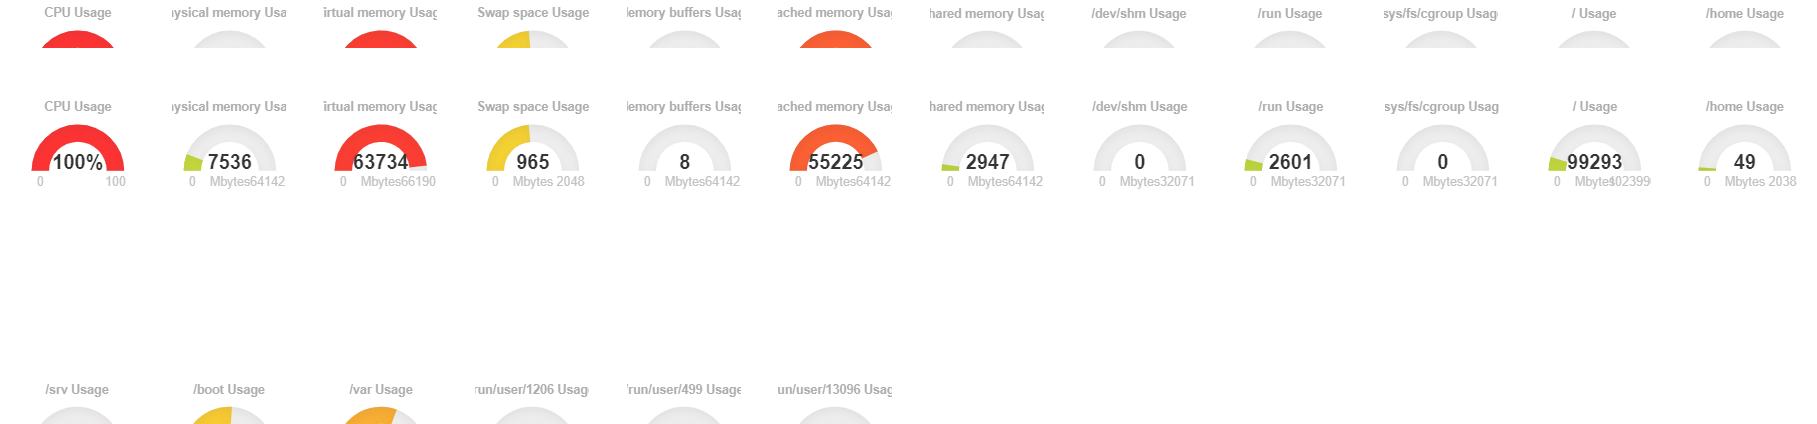
After I submit the update, then the widget will display with overlapping and duplication
I notice the server stats widget have overlapping and duplication after I submit the update.
If I enter edit mode, then the widget display with correct status
After I submit the update, then the widget will display with overlapping and duplication
Experiencing the exact same issue here. Same rendering on different browsers using the following.
|Version|1.70.1-31-ged41e6eed
Database Schema| - 020_11_02_164331_add_powerstate_enum_to_vminfo (191)
Web Server - nginx/1.18.0
PHP - 7.4.3
Python - 3.8.5
MySQL - 10.3.25-MariaDB-0ubuntu0.20.04.1
Laravel - 8.21.0
RRDtool - 1.7.2
Same on both OSX and Windows on the client side
You get anywhere resolving this issue?
Not yet, it sometimes work and sometimes doesn’t.
same here, only initially some gauges are clipped from view with duplication
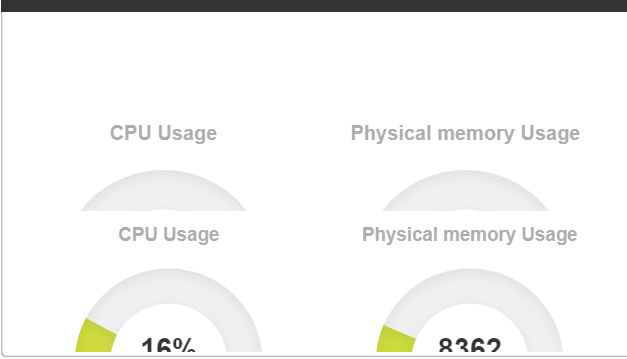
when the dashboard automatically refreshes (page_refresh setting) it fixes itself.
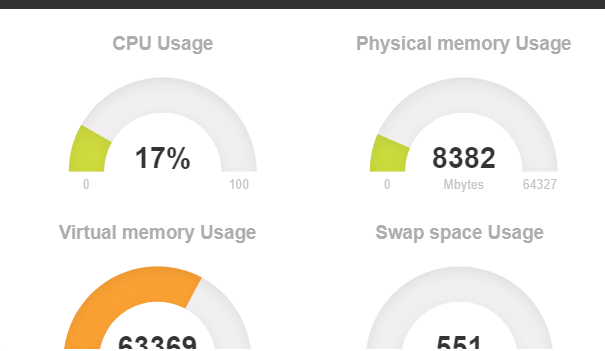
however if i do a manual browser refresh it changes back to being bugged again which is odd.
(i’m on ver 1.70.1, but i think this has existed for a while)
Here’s some more debugging… not sure if this is related but noticed this;
initial page load:
set_resolution response
1536x382
server_stats response
id: 53
dimensions[x]: 497.6666
dimensions[y]: 250.6666
settings: 0
After page is automatically refreshed through librenms and the displays correctly, /set_resolution isn’t called during that refresh, but it appears my width is a different value along with the server stat dimensions[x]
$(window).width();
1519
$(window).height();
382
and server_stats dimensions[x] is changed
id: 53
dimensions[x]: 492.6666
dimensions[y]: 250.6666
settings: 0
same behaviour across Chromium based browsers and Firefox
This topic was automatically closed 730 days after the last reply. New replies are no longer allowed.