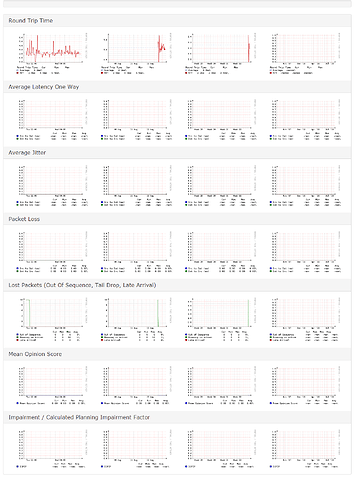
I have configured IPSLA udp-jitter on an ASR9k that I am also monitoring via LibreNMS. I am able to see that it detects udp-jitter IPSLA graphs, but it is missing some information. Based on #3550, it seems as if the IOS-XR platform is reading different OID’s for One Way Latency and Jitter. I don’t see ICPIF being monitored at all based on the ipsla output from the IOS-XR OS (likely that it’s not supported under IOS-XR? I didn’t look too much into it).
Here is the output I have for a udp-jitter IP SLA instance:
Entry number: 26
    Modification time: 13:57:13.976 EST Tue Aug 14 2018
    Start time       : 13:57:13.981 EST Tue Aug 14 2018
    Number of operations attempted: 284
    Number of operations skipped  : 0
    Current seconds left in Life  : Forever
    Operational state of entry    : Active
    Operational frequency(seconds): 20
    Connection loss occurred      : FALSE
    Timeout occurred              : FALSE
    Latest RTT (milliseconds)     : 2
    Latest operation start time   : 15:31:34.987 EST Tue Aug 14 2018
    Next operation start time     : 15:31:54.987 EST Tue Aug 14 2018
    Latest operation return code  : OK
    RTT Values:
      RTTAvg  : 2          RTTMin: 2          RTTMax : 3
      NumOfRTT: 10         RTTSum: 21         RTTSum2: 45
    Packet Loss Values:
      PacketLossSD       : 0          PacketLossDS : 0
      PacketOutOfSequence: 0          PacketMIA    : 0
      PacketLateArrival  : 0          PacketSkipped: 0
      Errors             : 0          Busies       : 0
      InvalidTimestamp   : 0
    Jitter Values :
      MinOfPositivesSD: 0          MaxOfPositivesSD: 0
      NumOfPositivesSD: 0          SumOfPositivesSD: 0
      Sum2PositivesSD : 0
      MinOfNegativesSD: 0          MaxOfNegativesSD: 0
      NumOfNegativesSD: 0          SumOfNegativesSD: 0
      Sum2NegativesSD : 0
      MinOfPositivesDS: 0          MaxOfPositivesDS: 0
      NumOfPositivesDS: 0          SumOfPositivesDS: 0
      Sum2PositivesDS : 0
      MinOfNegativesDS: 1          MaxOfNegativesDS: 1
      NumOfNegativesDS: 1          SumOfNegativesDS: 1
      Sum2NegativesDS : 1
      JitterAve: 1         JitterSDAve: 0      JitterDSAve: 1
      Interarrival jitterout: 0              Interarrival jitterin: 0
    One Way Values :
      NumOfOW: 10
      OWMinSD : 1          OWMaxSD: 1          OWSumSD: 10
      OWSum2SD: 10         OWAveSD: 1
      OWMinDS : 1          OWMaxDS: 2          OWSumDS: 11
      OWSum2DS: 13         OWAveDS: 1
From #3550, I am able to see jitter values from the snmpwalk:
$ snmpwalk -c community -v2c node .1.3.6.1.4.1.9.9.42.1.3.5.1.64
iso.3.6.1.4.1.9.9.42.1.3.5.1.64.26.401509614 = Gauge32: 1
iso.3.6.1.4.1.9.9.42.1.3.5.1.64.26.401869614 = Gauge32: 1
iso.3.6.1.4.1.9.9.42.1.3.5.1.64.28.401509614 = Gauge32: 1
iso.3.6.1.4.1.9.9.42.1.3.5.1.64.28.401869614 = Gauge32: 1
$ snmpwalk -c community -v2c node .1.3.6.1.4.1.9.9.42.1.3.5.1.63
iso.3.6.1.4.1.9.9.42.1.3.5.1.63.26.401509614 = Gauge32: 2
iso.3.6.1.4.1.9.9.42.1.3.5.1.63.26.401869614 = Gauge32: 2
iso.3.6.1.4.1.9.9.42.1.3.5.1.63.28.401509614 = Gauge32: 2
iso.3.6.1.4.1.9.9.42.1.3.5.1.63.28.401869614 = Gauge32: 2
$
But with that, I am not seeing any values graphed. Nor is the poller.php showing any values as well (snippet of poller.php for the cisco-sla module):
SNMP[/usr/bin/snmpget -v2c -c COMMUNITY -Otv -M /opt/librenms/mibs:/opt/librenms/mibs/cisco udp:HOSTNAME:161 sysUpTime.0]
sysUpTime.0: Unknown Object Identifier (Sub-id not found: (top) -> sysUpTime)

SLA 26: jitter   ()... 1ms at 2018-08-14 15:38:34\nRRD[update node/sla-26.rrd N:1 --daemon unix:/var/run/rrdcached.sock]
[RRD Disabled]RRD[update node/sla-26-jitter.rrd N:0:0:0:0:0:0:U:U:U:U:U --daemon unix:/var/run/rrdcached.sock]
[RRD Disabled]The following datasources were collected for #26:
Array
(
    [rtt] => 1
    [PacketLossSD] => 0
    [PacketLossDS] => 0
    [PacketOutOfSequence] => 0
    [PacketMIA] => 0
    [PacketLateArrival] => 0
    [MOS] => 0
    [ICPIF] =>
    [OWAvgSD] =>
    [OWAvgDS] =>
    [AvgSDJ] =>
    [AvgDSJ] =>
)
I did notice that the One Way latency OID’s for the XR appears to be the following:
rttMonLatestJitterOperOWSumSD | 1.3.6.1.4.1.9.9.42.1.5.2.1.33
rttMonLatestJitterOperOWSum2SD | 1.3.6.1.4.1.9.9.42.1.5.2.1.34
rttMonLatestJitterOperOWMinSD | 1.3.6.1.4.1.9.9.42.1.5.2.1.35
rttMonLatestJitterOperOWMaxSD | 1.3.6.1.4.1.9.9.42.1.5.2.1.36
rttMonLatestJitterOperOWSumDS | 1.3.6.1.4.1.9.9.42.1.5.2.1.37
rttMonLatestJitterOperOWSum2DS | 1.3.6.1.4.1.9.9.42.1.5.2.1.38
rttMonLatestJitterOperOWMinDS | 1.3.6.1.4.1.9.9.42.1.5.2.1.39
