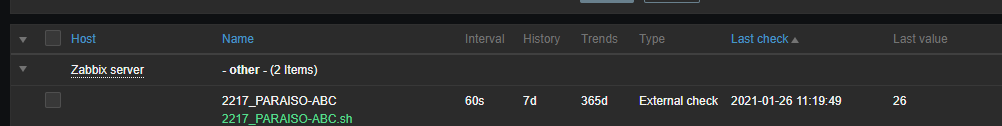
Greetings guys, I have a script that I run on zabbix to monitor a device, this script returns me a numerical value in which I can generate some graphs of this variation of values, can I replicate this in librenms? I already tested the script on the librenms server, but I don’t know how to generate graphics with it from that, did anyone get anything?
This topic was automatically closed 186 days after the last reply. New replies are no longer allowed.