run:
kill 14618
kill 2395
You need to kill those processes as I can see they are still running.
Kill all processes that says “map-poller.php” if you have to.
run:
kill 14618
kill 2395
You need to kill those processes as I can see they are still running.
Kill all processes that says “map-poller.php” if you have to.
Yes @kalamchi75 . I have killed them one by one using the F9 and SIGTERM command and that got rid of them. I see some difference in the utilization of the cores which was at a 100% full earlier.
I think I need to give it another 15 to 30 minutes for it to plot the stats of the localhost and then I will be able to see what the changes are.
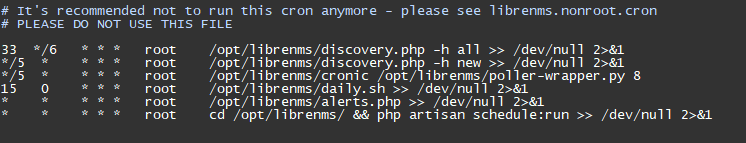
This is the cron file for now:
Thanks,
Santosh Kotla
alright, give it some time and see.
Good luck
Hi Sir @kalamchi75
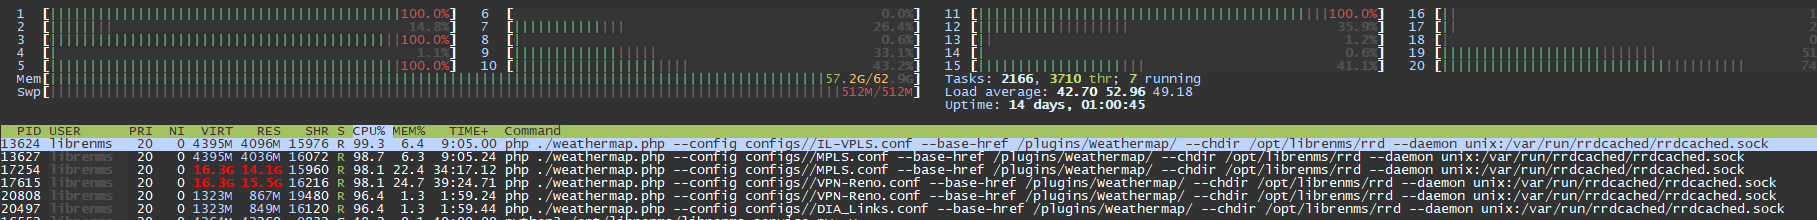
So I just had my lunch and came back to see that there were other three processes that were eating a 100% of the CPU and I killed them as well. These weathermap processes seem to come back after a few minutes.
Right now this is how it looks:
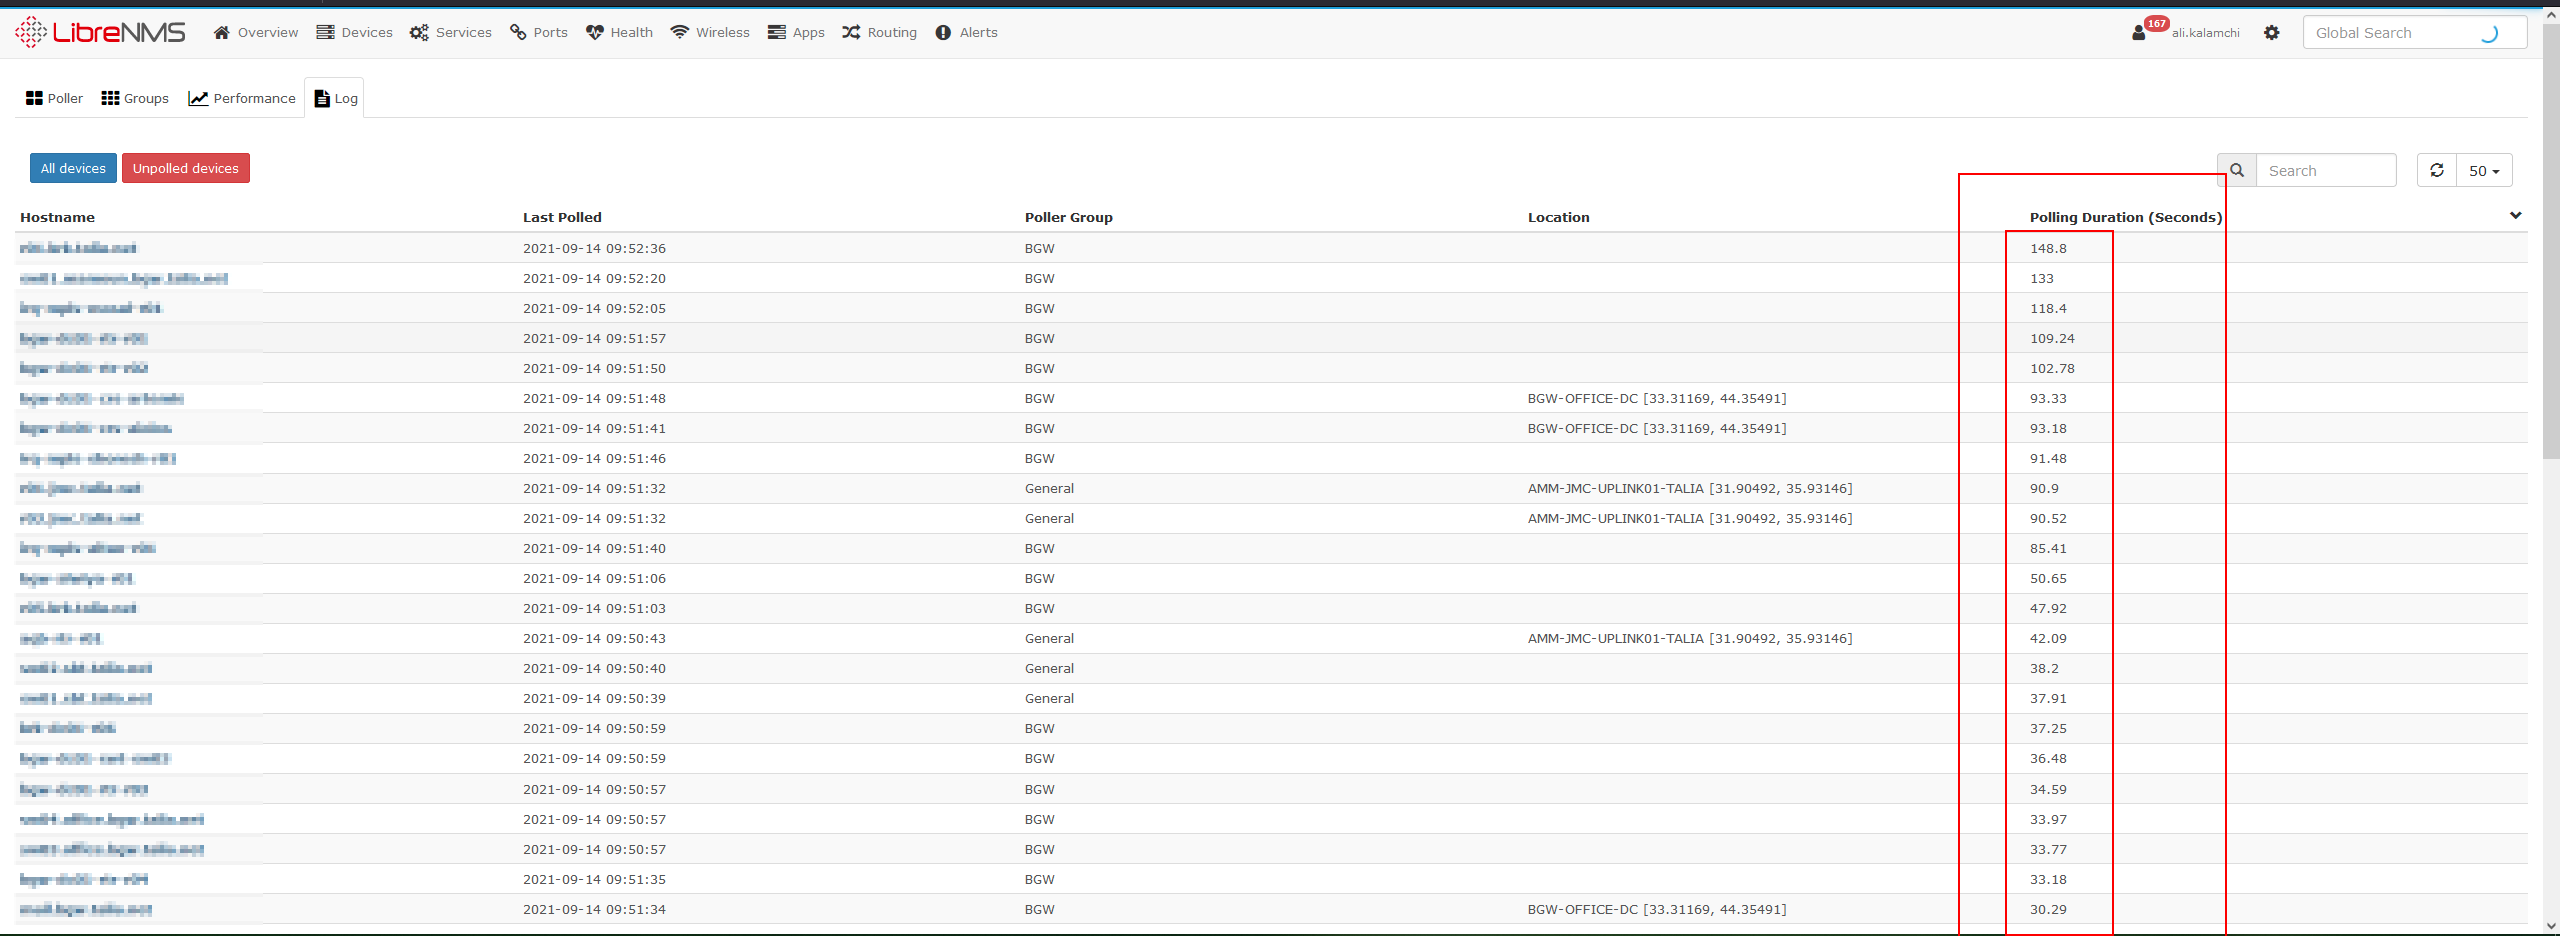
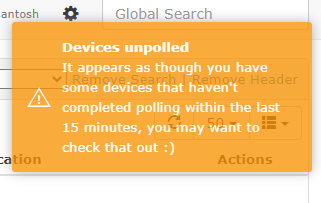
I keep getting this message that the some of the devices may not have completed polling and I need to take a look at them. It comes on the right up of the librenms page in Amber and then disappears. I am not sure if this is because the poller cannot handle 1300+ devices by itself single-handedly.
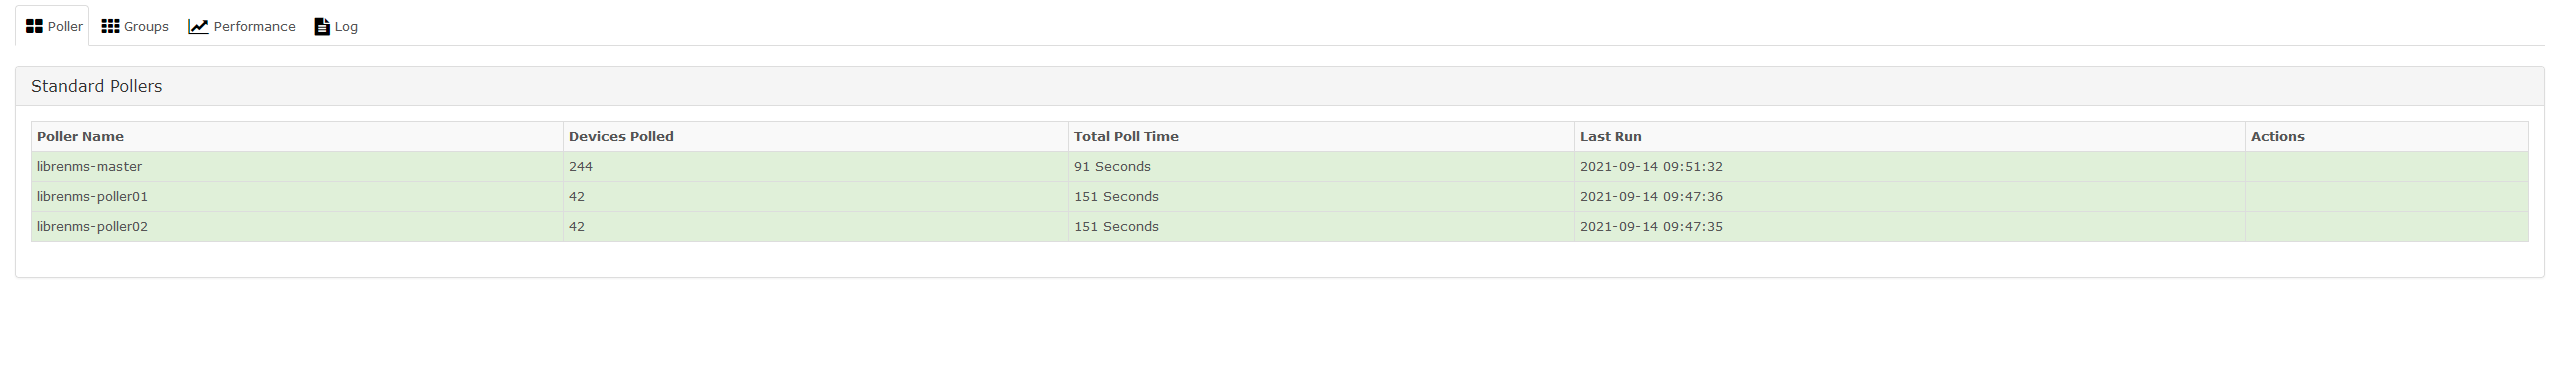
show me please the poller status from the GUI:
and
Check which of the machines are taking a long time to poll.
Increase your poller instances to 16 again in the cron, then reboot the server. At least you make sure all services/pollers and what not will be restarted.
Then inspect htop again and see what’s going on.
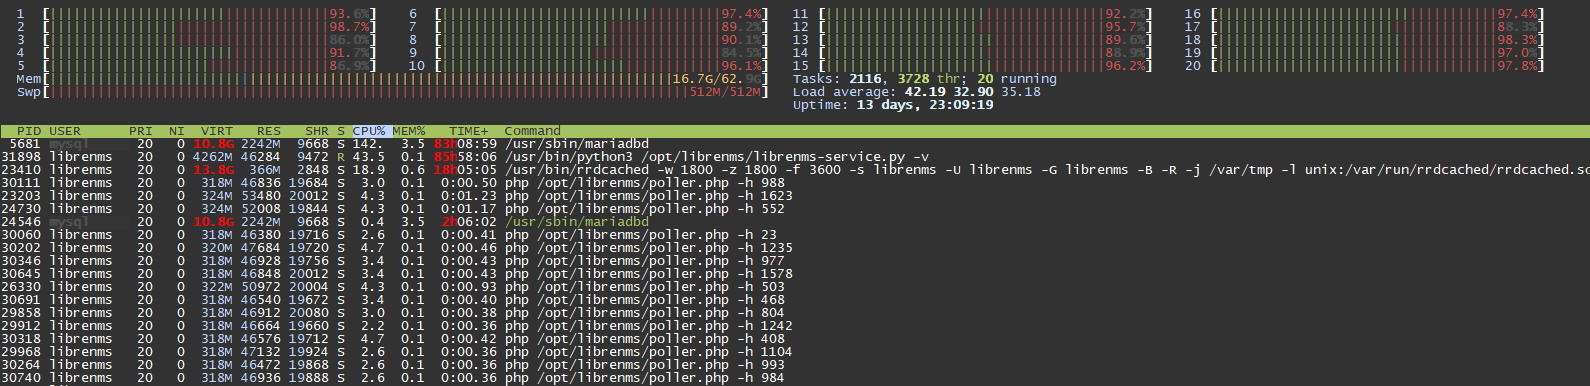
Hi @kalamchi75
This is what the htop looks like and those processes of the weathermap keep coming back for some reason.
I am trying to access my GUI and for some reason it is down. I have restarted nginx, mariadb and librenms but it’s still down:
Do you know what else can I check? This is what I see when the GUI is intermittently up:
But the tool is very very slow and hardly I get to see the page.
Thanks,
Santosh Kotla
Hi Santosh,
Have you actually rebooted the server ?
I think the reason for the GUI behaviour and the slowness is the load, and even the swap disk is full.
Perhaps you need to check with LibreNMS team on how to stop weathermaps from the time being.
Hi @kalamchi75
I have hit the server for the reboot now. I am still waiting for it to come up. Once it comes back online, I will come get the screenshots and send it across to you.
With so many issues, do you think a reinstall of the tool would make any sense?
Thanks,
Santosh Kotla
I wouldn’t advise to reinstall or not as this would lead to data loss 
It’s your call.
However, I think it might be still salvaged though.
Hi @kalamchi75
I agree to that. The tool has been rescued and I cannot afford a data loss even thought it has broken graphs for the past month, almost.
I don’t mind if the weathermaps plugin doesn’t work for now as we can have it run seperately as well but I need to get this up and working with a poller so that we have some solid monitoring base in the ecosystem.
Thanks,
Santosh Kotla
Hi @kalamchi75
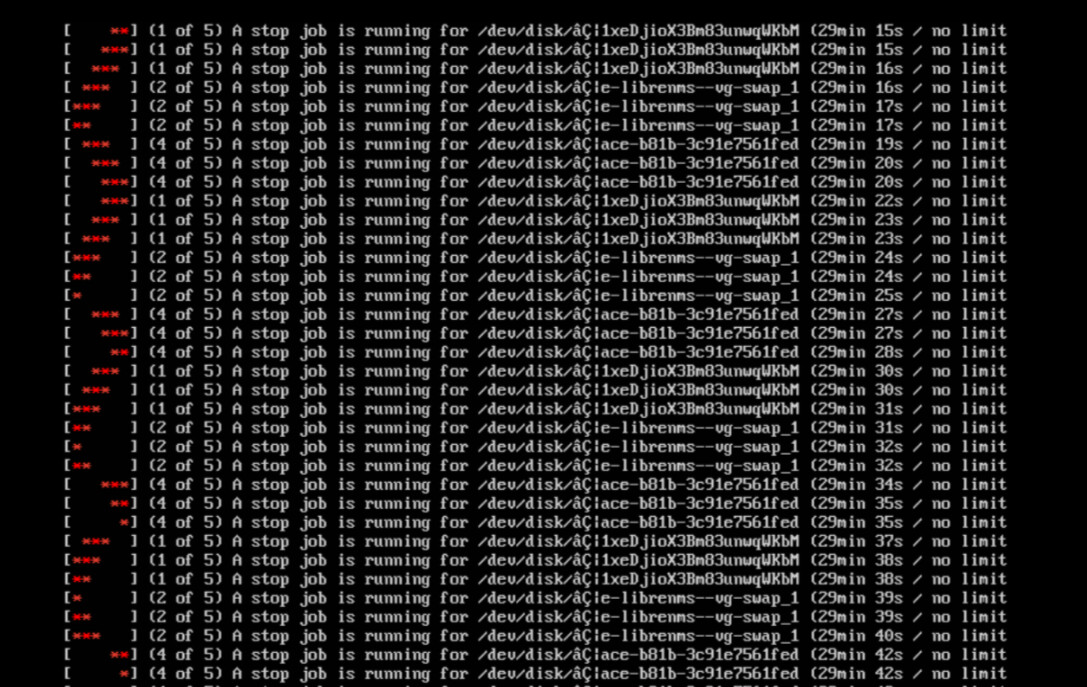
It’s been quite sometime I was waiting for the server to come back online and this is what I see.
I have requested one of the concerned team members to manually reboot that server for me. Can you please help me understand what these logs mean? Anything else that I can do to fix this software from hanging on a reboot/shutdown like this?
Thanks,
Santosh Kotla
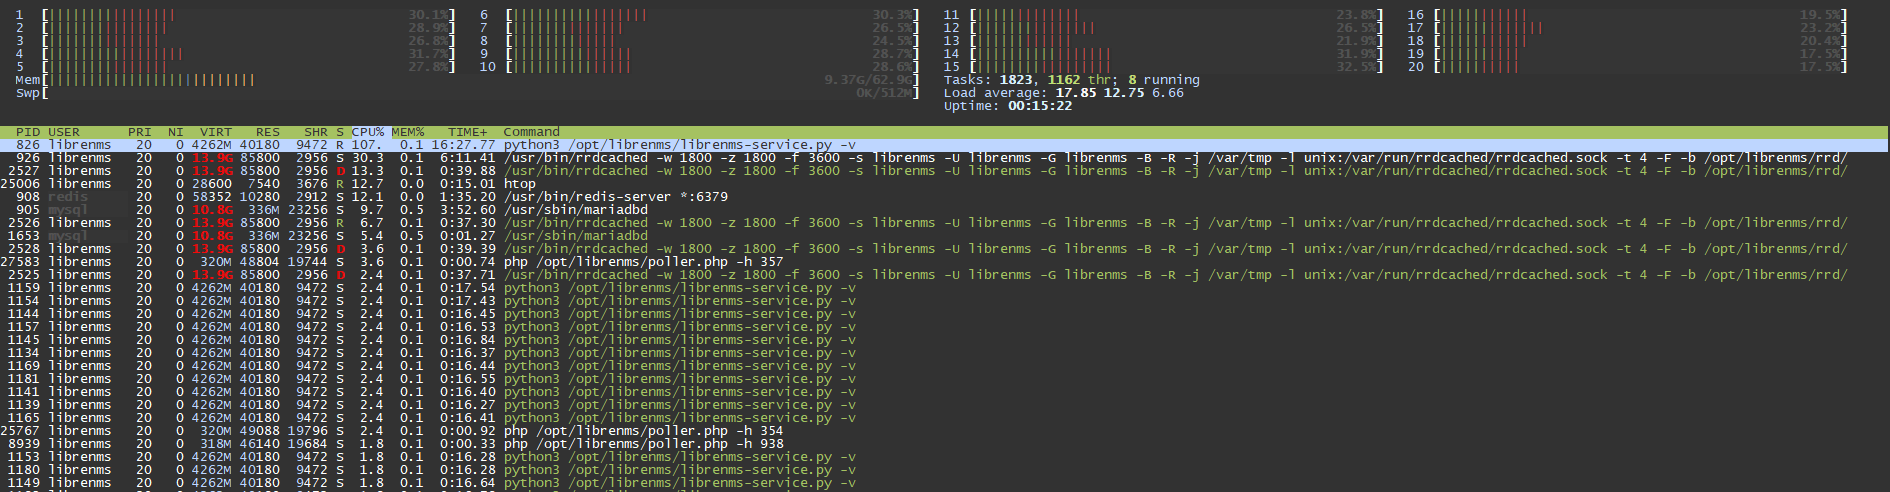
The server reboot is complete and it came back online.
The htop looks okay but the GUI is still super slow.
Thanks,
Santosh Kotla
give it few more minutes.
Do you use Apache ?
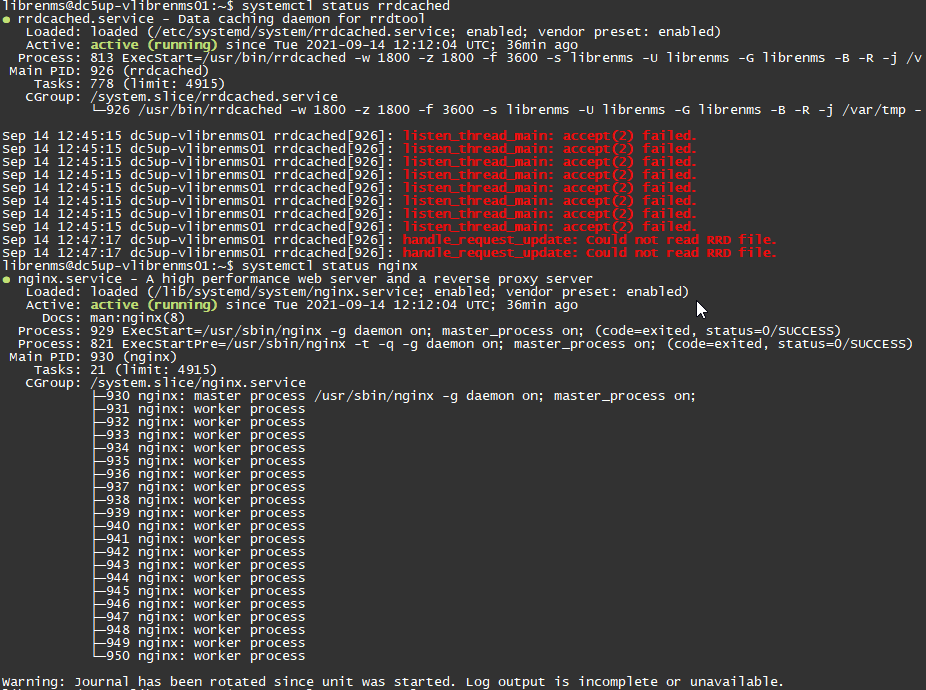
Hi @kalamchi75
I use NGINX. I just took a look at the rrdcached status and this is what I see.
Thanks,
Santosh Kotla
I thought a restart cleared the issue but it is cropping up the same thing.
As a result the graphs have stopped plotting.
Thanks,
Santosh Kotla
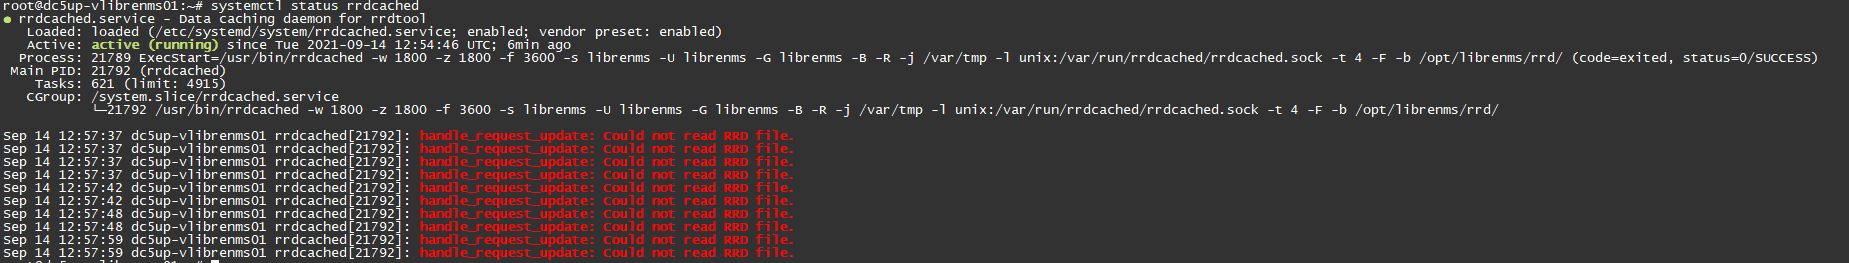
ok, now, disable rrdcached in your config, and stop rrdcached service.
try to make it work as standard LNMS, and graph again.
Done Sir. The graphs seems to be smooth now and they’re plotting.
What do you suggest as the next steps from here?
Thanks,
Santosh Kotla
ok that’s good news.
How does the load look like ?
How is the GUI response ?
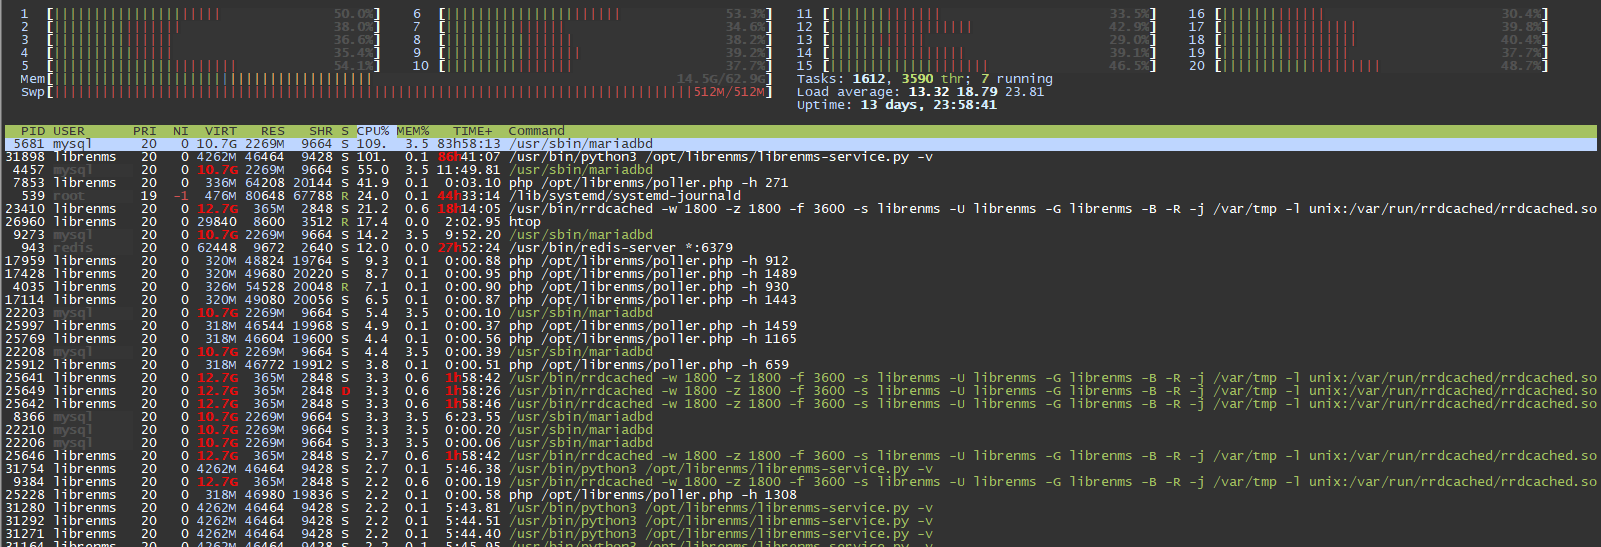
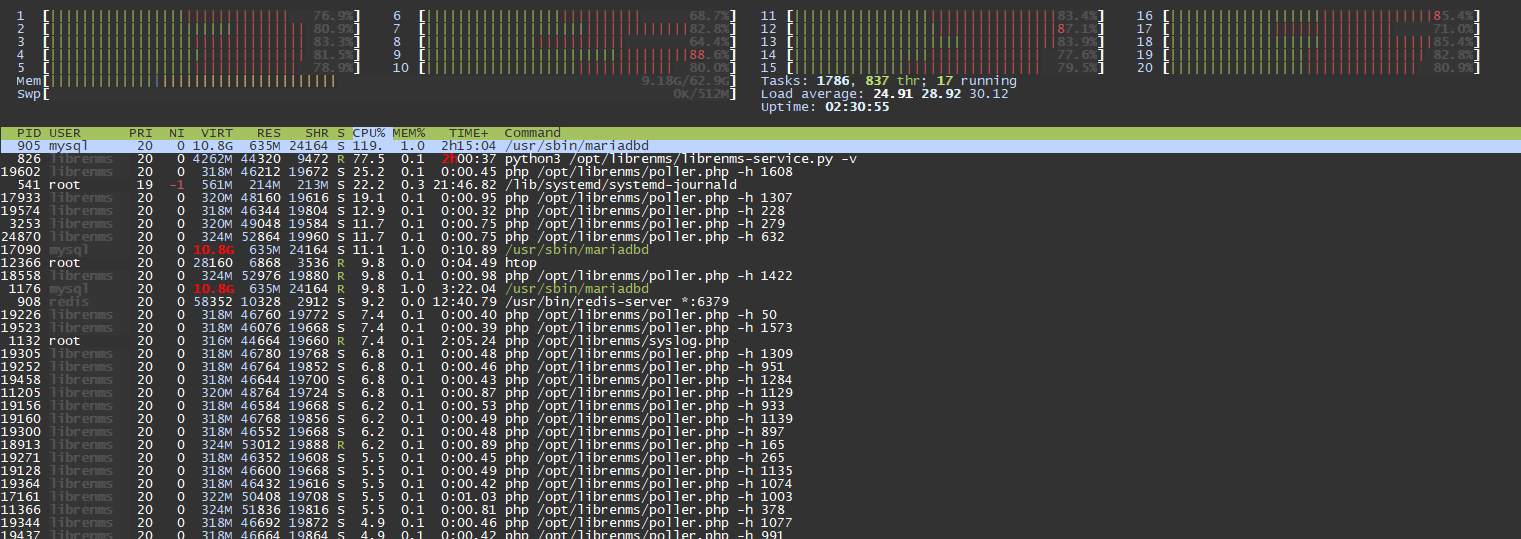
This is how htop looks like
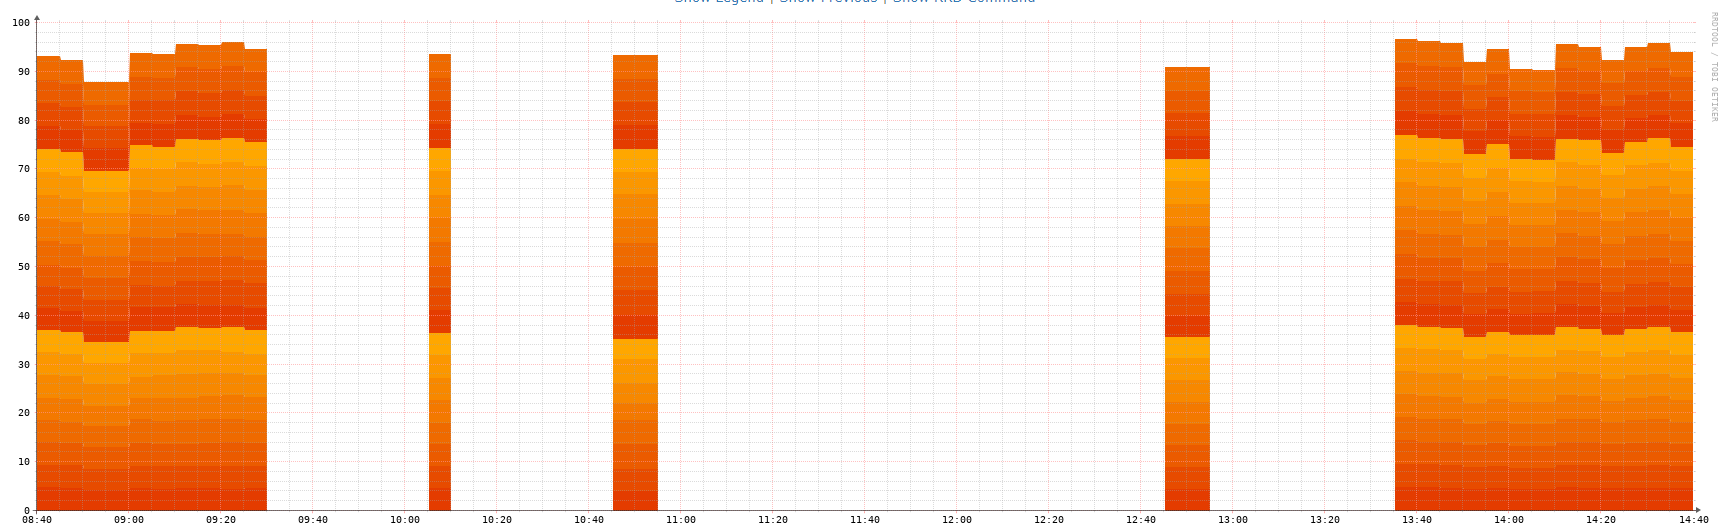
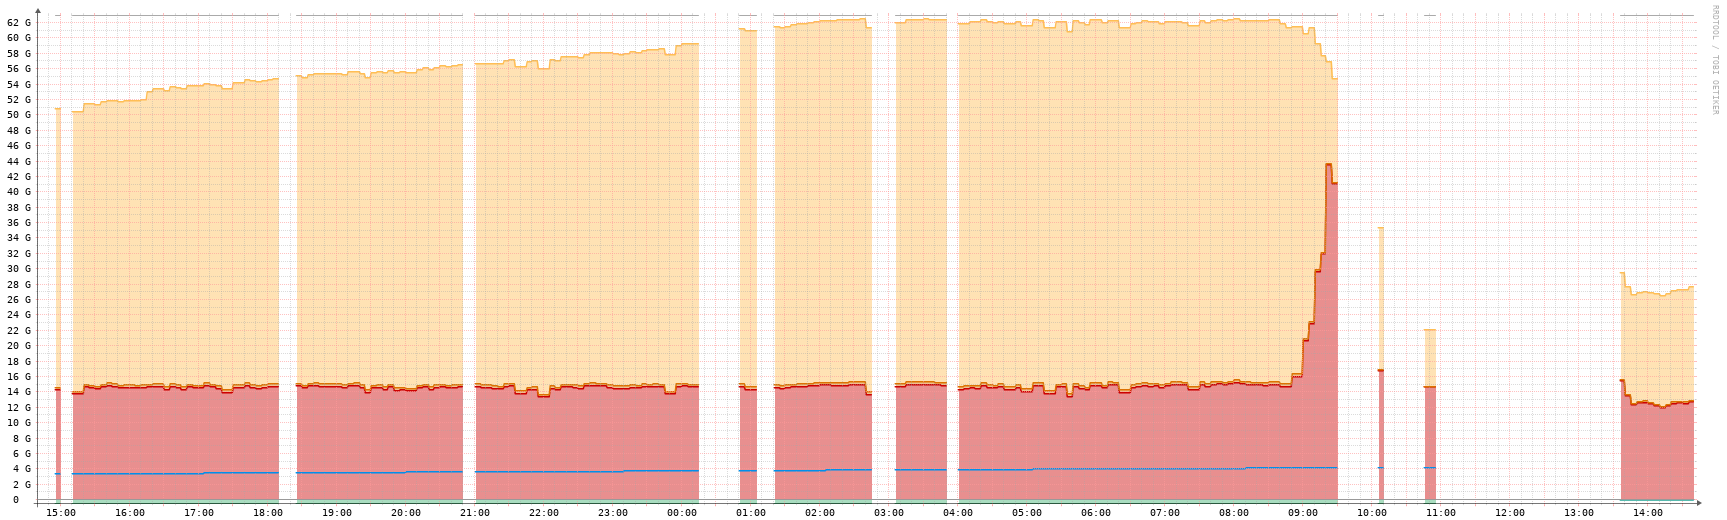
This is the graph from the localhost:
Memory seems to have dropped to half so far:
Thanks,
Santosh Kotla
Your load is still high though.
leave it running for tonight without any further changes.
Tomorrow inspect the graphs, inspect the poller times, the load … etc.
See if it at least runs smoothly overnight.
Then, the next step would be to figure our the errors we see in rrdcached.