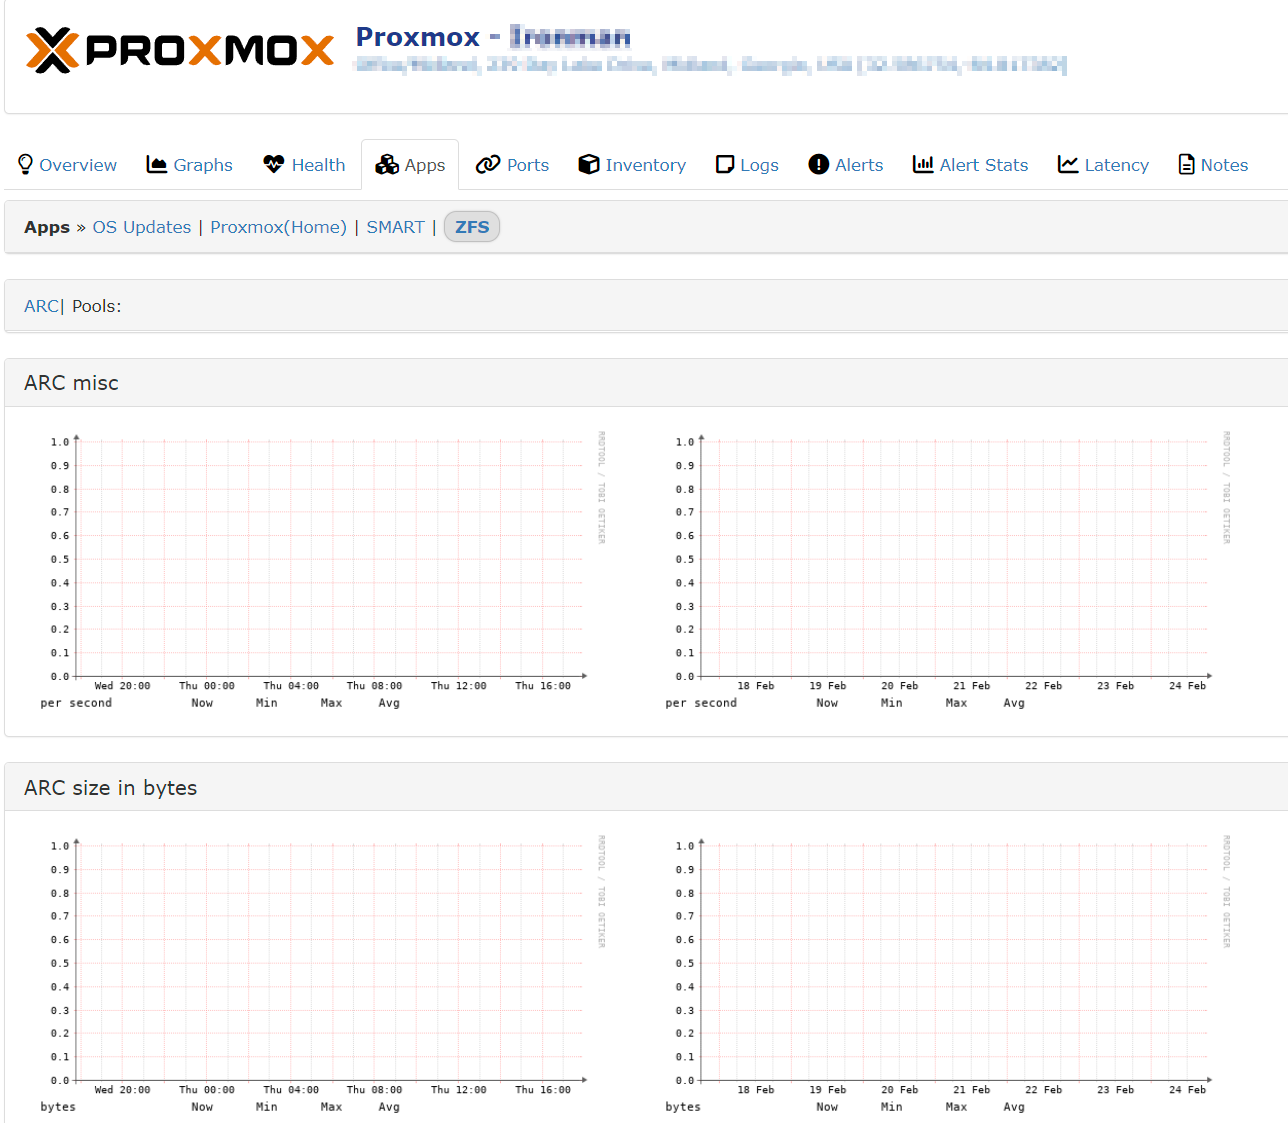
I followed the steps required to get ZFS monitoring setup on docs.librenms.org. All my other apps are working fine and graphing. But I have no idea why the graphs for ZFS(-linux) are not working.
Checking the logs, I saw SNMP had issues running the command on my Proxmox 7 server.
Saw in the syslog that SNMP was not able to run it for some reason so I modified in visudo:
Original:
snmp ALL=(ALL) NOPASSWD: /etc/snmp/zfs-linux
Fixed:
Debian-snmp ALL=(ALL) NOPASSWD: /etc/snmp/zfs-linux
Tested the script to be sure I was getting data
root@ironman:/etc/snmp# ./zfs-linux
{"deleted": 48, "evict_skip": 1, "mutex_skip": 0, "recycle_miss": 0, "arc_size": 10378730960, "target_size_max": 135065425920, "target_size_min": 8441589120, "target_size": 10922944384, "target_size_per": 8.087150586168306, "arc_size_per": 7.684224803871999, "target_size_arat": 0.08087150586168307, "min_size_per": 6.25, "mfu_size": 6488553664, "p": 4434390720, "rec_used_per": 40.59702735917546, "freq_used_per": 59.40297264082454, "arc_hits": 10763093, "arc_misses": 346716, "demand_data_hits": 3888104, "demand_data_misses": 305432, "demand_meta_hits": 6832027, "demand_meta_misses": 21166, "mfu_ghost_hits": 0, "mfu_hits": 9630584, "mru_ghost_hits": 0, "mru_hits": 1102847, "pre_data_hits": 343, "pre_data_misses": 8858, "pre_meta_hits": 42619, "pre_meta_misses": 42619, "anon_hits": 29662, "arc_accesses_total": 11109809, "demand_data_total": 4193536, "pre_data_total": 9201, "real_hits": 10733431, "cache_hits_per": 96.87919027230801, "cache_miss_per": 3.1208097276919884, "actual_hit_per": 96.61220098383329, "data_demand_per": 92.71660002441854, "data_pre_per": 3.727855667862189, "anon_hits_per": 0.2755899256840018, "mru_per": 10.246562024503552, "mfu_per": 89.47784804981245, "mru_ghost_per": 0.0, "mfu_ghost_per": 0.0, "demand_hits_per": 36.12441144938541, "pre_hits_per": 0.0031868162804130746, "meta_hits_per": 63.4764281977309, "pre_meta_hits_per": 63.4764281977309, "demand_misses_per": 88.09284832543062, "pre_misses_per": 2.5548287359106587, "meta_misses_per": 6.104708176144165, "pre_meta_misses_per": 3.2476147625145653, "pools": [{"name": "pool1", "size": "63771674411008", "alloc": "39480077586432", "free": "24291596824576", "ckpoint": 0, "expandsz": 0, "frag": "4", "cap": "61", "dedup": "1.00", "health": "ONLINE", "altroot": "-"}]}
I still have no idea where else to look
Other troubleshooting done:
l
ibrenms@LibreNMS:~$ ./validate.php
====================================
Component | Version
--------- | -------
LibreNMS  | 22.2.1-6-g703745d0e
DB Schema | 2022_02_03_164059_increase_auth_id_length (235)
PHP       | 7.4.3
Python    | 3.8.10
MySQL     | 10.3.32-MariaDB-0ubuntu0.20.04.1
RRDTool   | 1.7.2
SNMP      | 5.8
====================================

[OK]    Composer Version: 2.2.6
[OK]    Dependencies up-to-date.
[OK]    Database connection successful
[OK]    Database schema correct
root@ironman:/etc/snmp# cat snmpd.conf
agentAddress  udp:161,tcp:161
rocommunity XXXX 10.0.0.0/8

sysLocation XXXX
sysContact XXXX

# This line allows Observium to detect the host OS if the distro script is installed
extend .1.3.6.1.4.1.2021.7890.1 distro /usr/local/bin/distro
# This lines allows Observium to detect hardware, vendor and serial
extend .1.3.6.1.4.1.2021.7890.2 hardware /bin/cat /sys/devices/virtual/dmi/id/product_name
extend .1.3.6.1.4.1.2021.7890.3 vendor   /bin/cat /sys/devices/virtual/dmi/id/sys_vendor
#extend .1.3.6.1.4.1.2021.7890.4 serial   /bin/cat /sys/devices/virtual/dmi/id/product_serial
# This line allows Observium to collect an accurate uptime
extend uptime /bin/cat /proc/uptime
# This line enables Observium's ifAlias description injection
#pass_persist .1.3.6.1.2.1.31.1.1.1.18 /usr/local/bin/ifAlias_persist


# This allows to collect Proxmox attributes
extend proxmox /usr/bin/sudo /usr/local/bin/proxmox

# This allows to collect OS updates
extend osupdate /etc/snmp/osupdate

# This allows to collect SMART attributes
extend smart /etc/snmp/smart

# ZFS Monitoring
extend zfs /usr/ /etc/snmp/zfs-linux
Anyone have suggestions or other troubleshooting steps?