Pulse Secure Appliances are mostly used for client-to-site VPN. At the moment there is only one graph under “Firewall” for concurrent users. I miss graphs for IPSec tunnels, Total users (for active/active clusters) and device temperature.
Please add graphs for:
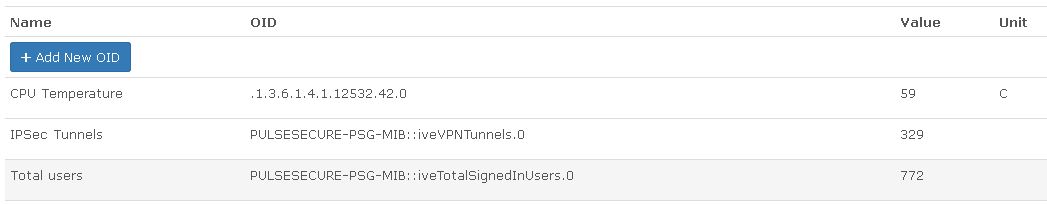
CPU Temperature:
snmpwalk -v2c -c xxxxxxx 1.2.3.4 .1.3.6.1.4.1.12532.42.0
returns:
PULSESECURE-PSG-MIB::iveTemperature.0 = Gauge32: 48
IPSec tunnels:
snmpwalk -v2c -c xxxxxxx 1.2.3.4 PULSESECURE-PSG-MIB::iveVPNTunnels.0
returns:
PULSESECURE-PSG-MIB::iveVPNTunnels.0 = Gauge32: 328
Total users:
snmpwalk -v2c -c xxxxxxx 1.2.3.4 PULSESECURE-PSG-MIB::iveTotalSignedInUsers.0
returns:
PULSESECURE-PSG-MIB::iveTotalSignedInUsers.0 = Gauge32: 740