I’m still digging into the more advanced alerting myself, but some thoughts that may assist:
Slow queries:
Have a look at Applications and ‘the Agent’ and SNMP extend: Applications - LibreNMS Docs
You could rework these ideas to retrieve slow queries information using a script and feed it back to metics in LibreNMS - you can then access those metrics in application_metrics table to generate alerts.
I’ve not used the mysql agent setup yet, but if it doesn’t handle slow queries - have a look at another application like docker in the list and see what the scripts do - they can be quite simple, though not sure if they have matching code to handle them within LibreNMS themselves - certainly the graphs do, but you may be able to get non-graphed data in to the database without much effort.
Custom OIDS
Can’t seem to access the correct doco for this lately, but on the device config you can add custom values which then appear in the customoids table:
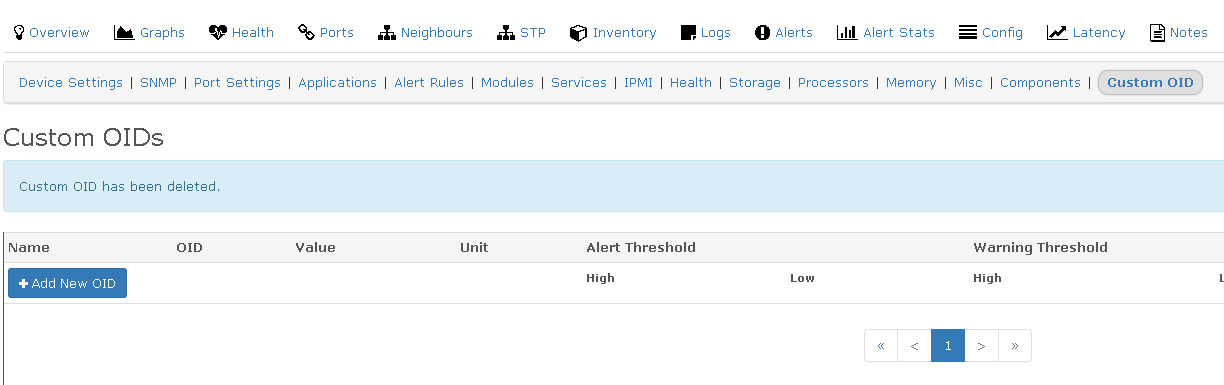
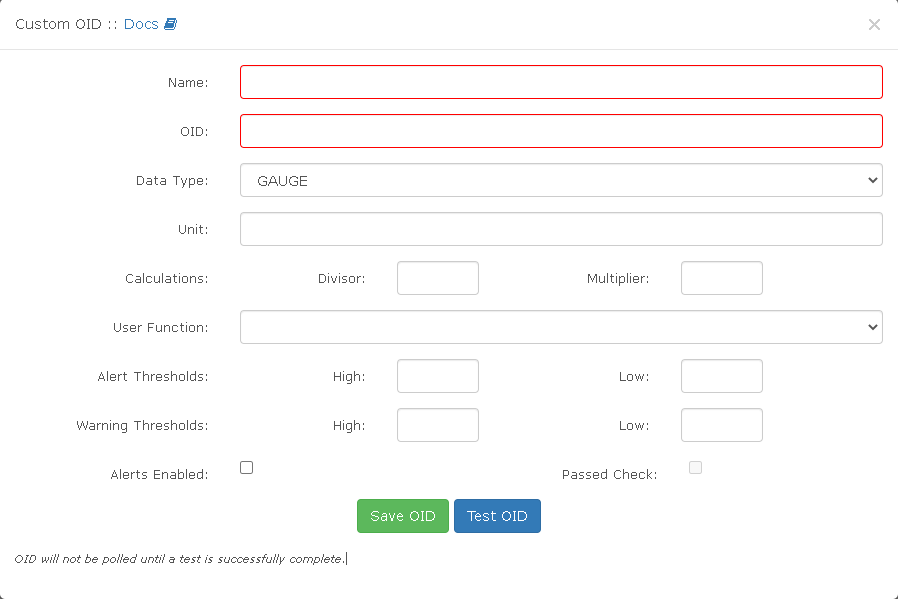
If you can use an SNMP extend (or exec) script to get a value in to an OID - you could get it polling quite easily that way.
Alerts > 5mins:
For alerting > 5 minutes values, processors have their own table which doesn’t hold the previous value, unlike sensors such as temperature which have a _current and _prev value you can use in rules. However, you can use the Alert Delay to help with this: Rules - LibreNMS Docs and maybe see Alert if device is down for XXX amount of time - #13 by Kevin_Krumm
I’ve used a delay before to prevent quick 95% port utilisation spikes from being alerted that only happen within a 5min window - I was only interested if they were sustained for longer - so this kept them quiet. In your case, the opposite would be true - should be able to get something working so you delay the 100% CPU alert by 5+ minutes so it will only let you know when it’s was triggered and maintained until the delay time expires.