Open dev console in browser and check for errors.
Also, click on the graph and turn on the rrdtool debug
Open dev console in browser and check for errors.
Also, click on the graph and turn on the rrdtool debug
Ok, how do I do this? Can you provide me some links from the documentation? Thanks so far.
For dev console, just press F12 in your browser and refresh page.
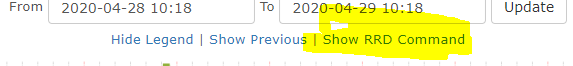
For the rrdtool debug, I meant show rrd command
This is what I get from the Chrome console:
DevTools failed to load SourceMap: Could not load content for chrome-extension://gighmmpiobklfepjocnamgkkbiglidom/include.preload.js.map: HTTP error: status code 404, net::ERR_UNKNOWN_URL_SCHEME
DevTools failed to load SourceMap: Could not load content for chrome-extension://gighmmpiobklfepjocnamgkkbiglidom/include.postload.js.map: HTTP error: status code 404, net::ERR_UNKNOWN_URL_SCHEME
This is the RRD command:
RRDTool Command
rrdtool graph /tmp/jwVGqOZfWJrRMnYd --alt-autoscale-max --rigid -E --start 1588063807 --end 1588150207 --width 1152 --height 512 -c BACK#EEEEEE00 -c SHADEA#EEEEEE00 -c SHADEB#EEEEEE00 -c CANVAS#FFFFFF00 -c GRID#a5a5a5 -c MGRID#FF9999 -c FRAME#5e5e5e -c ARROW#5e5e5e -R normal -c FONT#000000 --font LEGEND:8:DejaVuSansMono --font AXIS:7:DejaVuSansMono --font-render-mode normal DEF:poutoctets=/opt/librenms/rrd/hdrs001.tangro.de/ucd_ssIORawSent.rrd:value:AVERAGE DEF:pinoctets=/opt/librenms/rrd/hdrs001.tangro.de/ucd_ssIORawReceived.rrd:value:AVERAGE DEF:poutoctets_max=/opt/librenms/rrd/hdrs001.tangro.de/ucd_ssIORawSent.rrd:value:MAX DEF:pinoctets_max=/opt/librenms/rrd/hdrs001.tangro.de/ucd_ssIORawReceived.rrd:value:MAX CDEF:inoctets=pinoctets,512,* CDEF:outoctets=poutoctets,512,* CDEF:inoctets_max=pinoctets_max,512,* CDEF:outoctets_max=poutoctets_max,512,* CDEF:octets=inoctets,outoctets,+ CDEF:doutoctets=outoctets,-1,* CDEF:outbits=outoctets,8,* CDEF:outbits_max=outoctets_max,8,* CDEF:doutoctets_max=outoctets_max,-1,* CDEF:doutbits=doutoctets,8,* CDEF:doutbits_max=doutoctets_max,8,* CDEF:inbits=inoctets,8,* CDEF:inbits_max=inoctets_max,8,* VDEF:totin=inoctets,TOTAL VDEF:totout=outoctets,TOTAL VDEF:tot=octets,TOTAL CDEF:dpercentile_outn=doutbits,-1,* VDEF:dpercentile_outnp=dpercentile_outn,95,PERCENT CDEF:dpercentile_outnpn=doutbits,doutbits,-,dpercentile_outnp,-1,*,+ VDEF:dpercentile_out=dpercentile_outnpn,FIRST VDEF:percentile_in=inbits,95,PERCENT VDEF:percentile_out=outbits,95,PERCENT COMMENT:‘bps Now Ave Max 95th %\n’ AREA:inbits_max#D7FFC7: AREA:inbits#90B040: LINE:inbits#608720:‘In ’ GPRINT:inbits:LAST:%6.2lf%s GPRINT:inbits:AVERAGE:%6.2lf%s GPRINT:inbits_max:MAX:%6.2lf%s GPRINT:percentile_in:%6.2lf%s\n AREA:doutbits_max#E0E0FF: AREA:doutbits#8080C0: LINE:doutbits#606090:‘Out’ GPRINT:outbits:LAST:%6.2lf%s GPRINT:outbits:AVERAGE:%6.2lf%s GPRINT:outbits_max:MAX:%6.2lf%s GPRINT:percentile_out:%6.2lf%s\n GPRINT:tot:‘Total %6.2lf%sB’ GPRINT:totin:’(In %6.2lf%sB’ GPRINT:totout:‘Out %6.2lf%sB)\l’ LINE1:percentile_in#aa0000 LINE1:dpercentile_out#aa0000
RRDTool Output
1233x609
OK u:0.11 s:0.01 r:0.12
That looks ok…
Are only the dashboard graphs broken or all of em?
All graphs are broken. This occured with a nightly build in March for the first time. I rolled back to 1.62 stable, that fixed it back then. Now with 1.63 stable out it re-occured…
Could it be some kind of user permission?
Do you remember when it happened to you so we can check what was merged that could affect your graphs
I didn’t mess with user rights in the filesystem. It started with the nightly build 28 days ago, when the graphs stopped working, identically to the threadopener.
| Component | Version |
|---|---|
| LibreNMS | 1.63-3-g3e08e6d6d |
| DB Schema | 2020_04_13_150500_add_last_error_fields_to_bgp_peers (164) |
| PHP | 7.2.24-0ubuntu0.18.04.4 |
| MySQL | 10.1.44-MariaDB-0ubuntu0.18.04.1 |
| RRDTool | 1.7.0 |
| SNMP | NET-SNMP 5.7.3 |
====================================
[OK] Composer Version: 1.10.5
[OK] Dependencies up-to-date.
[OK] Database connection successful
[OK] Database schema correct
Any other hints?
Im having the exact same issue with graphs - all them appear to be broken - My system auto updated and since then they have been broken
| Version | 1.63 - Tue Apr 28 2020 04:52:42 GMT+0100 |
|---|---|
| Database Schema | 2020_04_19_010532_eventlog_sensor_reference_cleanup (164) |
| Web Server | nginx/1.14.0 |
| PHP | 7.2.24-0ubuntu0.18.04.1 |
| MySQL | 10.1.41-MariaDB-0ubuntu0.18.04.1 |
| RRDtool | 1.7.0 |
Ok: Database schema correct
Ok: Composer Version: 1.10.5
Ok: Dependencies up-to-date.
Maybe it’ something about RRD 1.7.0? Unfortunately I can’t rollback to an older version.
At least, I’m happy I’m not the only one…
really need a fix for this asap ![]()
With permissions I mean if your user is admin in librenms gui
Yes, i just checked. Both, a user with admin rights and a read-only user, don’t get any graphs.
What if you run ./daily.sh, the output looks correct or have weird things?
This is what I get:
id: ‘\nlibrenms’: no such user
WARNING: You should run this script as
librenms
Updating to latest codebase OK
id: ‘\nlibrenms’: no such user
WARNING: You should run this script as
librenms
Updating Composer packages OK
Updated from 3e08e6d6d to 33e0d1303 OK
Updating SQL-Schema OK
Updating submodules OK
Cleaning up DB OK
Fetching notifications OK
Caching PeeringDB data OK
Ok.
We are just with other user in our discord server trying to reach where the hell that \n is added.
It is added in the config.php file somehow, we are just now determining where.
What the user in discord is just doing now is:
Backup config.php (mv config.php config.php.bak)
Copy default config (cp config.php.default config.php)
Edit config.php to edit SQL credentials and relevant configuration (like rrdcached, base ref, etc)
If its a default install, only SQL credentials are needed.
cheers for doing some diagnostics with me on Discord
we have proved that a new config.php resolves the Graph issue, But need to find out now how we can fix existing config.php users have
The following worked for me
mv config.php config.php.bak - Move config
cp config.php.default config.php - copy default to new config
diff -u config.php config.php.bak - will show differences in current config and back up config
Then once i seen the difference i manually updated nano config.php
then ctrl + X and Y and save config.php
Then my graphs worked
heres an example of how my default config.php looked compared to config.php bak db password removed
$config[‘db_host’] = ‘localhost’;
-$config[‘db_user’] = ‘USERNAME’;
-$config[‘db_pass’] = ‘PASSWORD’;
+$config[‘db_user’] = ‘librenms’;
+$config[‘db_pass’] = ‘Check KeePass’;
$config[‘db_name’] = ‘librenms’;
// This is the user LibreNMS will run as
@@ -14,7 +15,7 @@
-$config[‘base_url’] = “/”;
+$config[‘base_url’] = “/”;
@@ -49,3 +50,9 @@
$config[‘show_services’] = 1;
+$config[“rrdcached”] = “unix:/var/run/rrdcached/rrdcached.sock”;
+$config[“update_channel”] = “release”;
+$config[“enable_syslog”] = 1;
+$config[‘force_ip_to_sysname’] = true;
+$config[‘force_hostname_to_sysname’] = true;
+$config[‘webui’][‘custom_css’][] = “css/custom/styles.css”;
then i also ran ./daily.sh with no errors
librenms@librenms:~$ ./daily.sh
Updating to latest release OK
Updating Composer packages OK
Updating SQL-Schema OK
Updating submodules OK
Cleaning up DB OK
Fetching notifications OK
Caching PeeringDB data OK
Thanks, I will try this later and post my results.