Good Morning!
I have some troubles in the network regarding microbursts, ie where a 10G link (or multiple 1G) narrows down and the TX buffer in the switch will overflow and discard packets.
As a long user of LibreNMS i thought that will be visible under ports and therefore the error-graph, but it seems that the counter which increases is not plotted here.
Currently i added some ‘custom oid’ sensors to have at least a little grasp at the problem, but for 500 Ports in up state (and ~1300 intermittent client ports in multiple offices) things get messy, quick.
In my mind, i want to add it to the error-graph specifically, so that i can use the ‘errored ports’-functionality. Checking dozens of graphs on a daily basis is okay in the troubleshooting phase, but i hope there is a better way in the long term.
Sadly, mikrotik has multiple counters, but some of them don´t work(?)
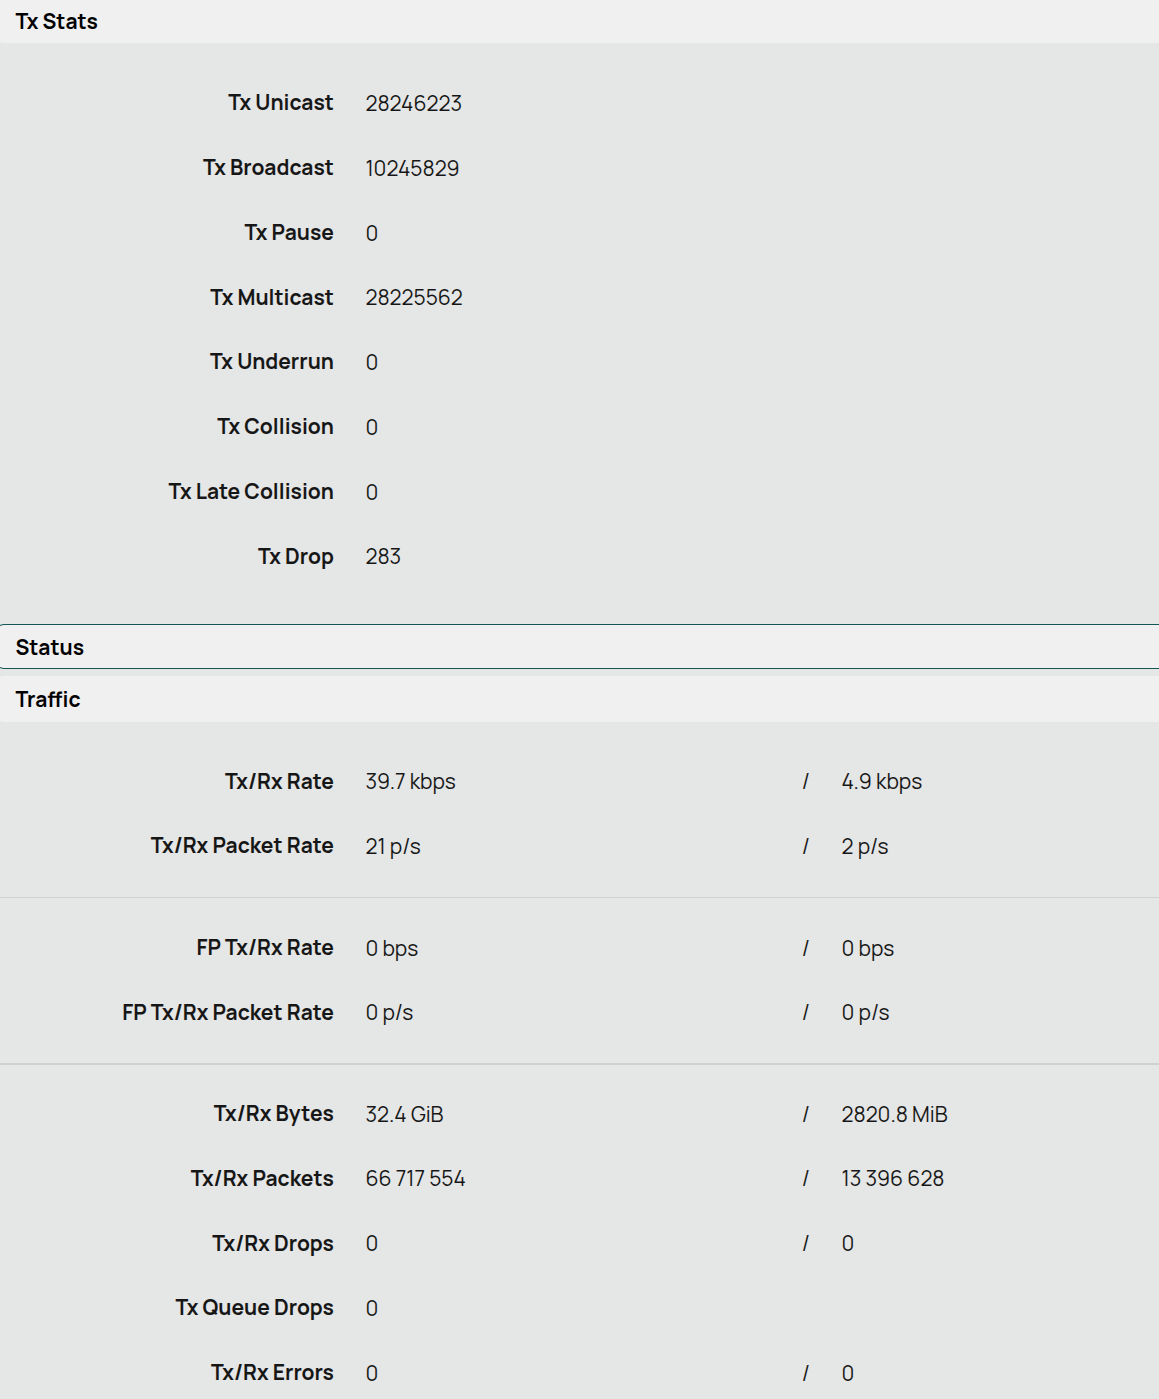
I think LibreNMS graphing counters which are always 0. I want to get a crasp of the counter which is showing "283"in this example image.
In mikrotik, the counter/oid of interest is:
.1.3.6.1.4.1.14988.1.1.14.1.1.85.16
where ´.16´ is port 16
I studied the documentation back and forth, even tried Gemini in an long and frustrating session - lol ![]() .
.
I have a feeling that it is quiet simple to add “more lines” to the error graph, but sadly i have no point to grab and fiddle around.
Is some dev here who maybe knows which mib, definition or whatever to extend/edit?
I just need a starting point to do the work myself ![]() ,
,
thank you veeery much in advance,
Mirco