| Component | Version |
|---|---|
| LibreNMS | 24.2.0 (2024-02-27T20:54:10+02:00) |
| DB Schema | 2024_02_07_151845_custom_map_additions (290) |
| PHP | 8.1.18 |
| Python | 3.8.10 |
| Database | MariaDB 10.3.39-MariaDB-0ubuntu0.20.04.2 |
| RRDTool | 1.7.2 |
| SNMP | 5.8 |
| =========================================== |
[OK] Composer Version: 2.7.1
[OK] Dependencies up-to-date.
[OK] Database connection successful
[OK] Database Schema is current
[OK] SQL Server meets minimum requirements
[OK] lower_case_table_names is enabled
[OK] MySQL engine is optimal
[OK] Database and column collations are correct
[OK] Database schema correct
[OK] MySQL and PHP time match
[OK] Active pollers found
[OK] Dispatcher Service not detected
[OK] Locks are functional
[OK] Python poller wrapper is polling
[OK] Redis is unavailable
[OK] rrd_dir is writable
[OK] rrdtool version ok
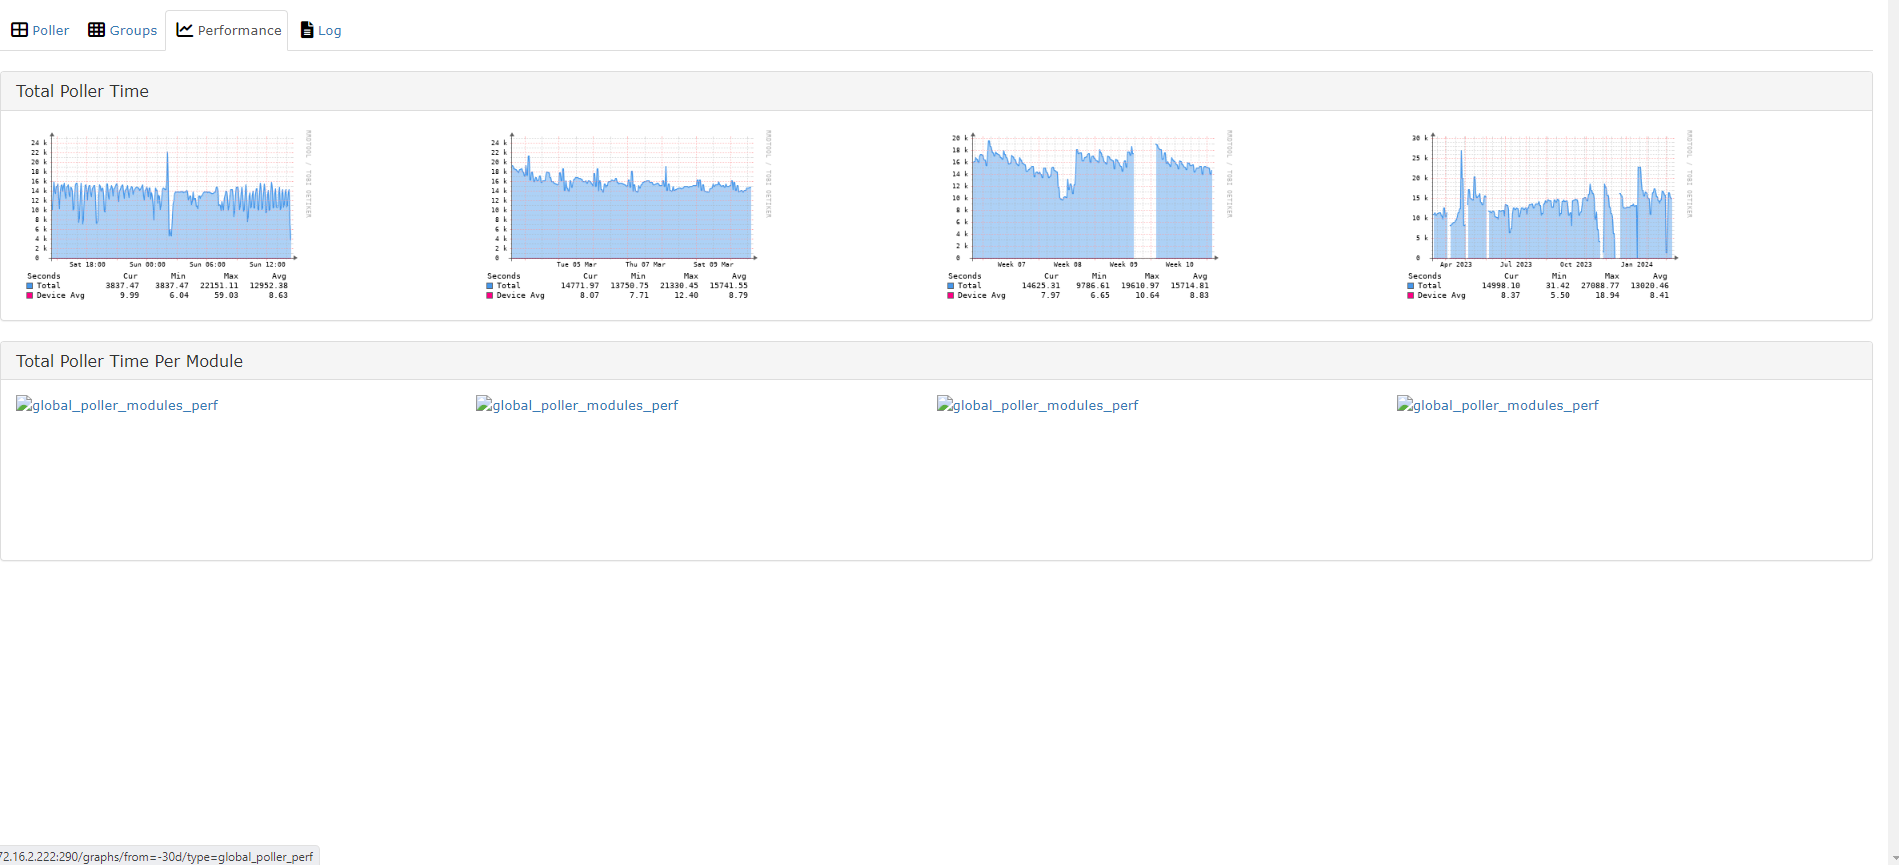
after upgrade to latest version all graph is drops i reboot more than time nothing changed note that before the update system was work fine im using 38 worker i have like 2300 device total polled time 592 with so many unpolled devices , im using normal poller can u help me please