Hello,
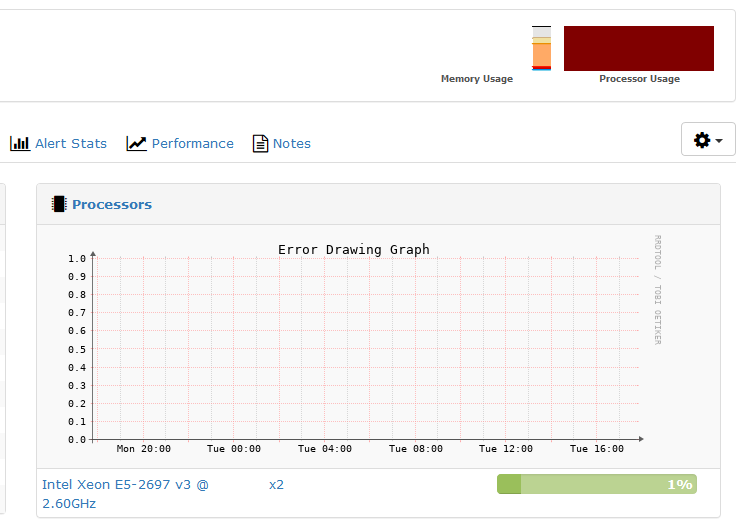
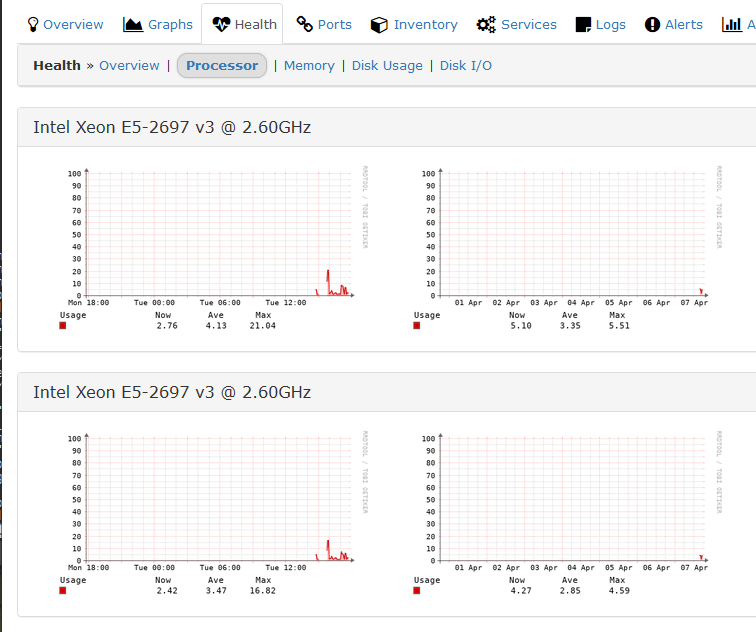
I have a new install of LibreNMS, but I’ve been using LibreNMS for the past couple months on another install. This is my first go at a distributed poller. I have a database server with redis, memcached and mariadb. I then have a poller with rrdcached and then a web server, all running FreeBSD 12.1. Everything works flawlessly so far, except for any graphs that include multiple items (ie, aggregate processor or interface graphs). When I view the graphs of individual items (even those included in the aggregate graph) they view and graph fine.
This happens on all servers I’ve tried to monitor. (2x FreeBSD and 2x Windows 2016 w/ MS SNMP service). My other install of LibreNMS is not exhibiting this behaviour.
I can run both the webui and cli validate without any issues. Below is the output of the cli validate script:
| Component | Version |
|---|---|
| LibreNMS | 1.62-28-g5f2eab0ba |
| DB Schema | 2020_03_25_165300_add_column_to_ports (161) |
| PHP | 7.4.4 |
| MySQL | 10.4.12-MariaDB |
| RRDTool | 1.7.2 |
| SNMP | NET-SNMP 5.7.3 |
| ==================================== |
[OK] Composer Version: 1.10.1
[OK] Dependencies up-to-date.
[OK] Database connection successful
[OK] Database schema correct
RRD CACHE Config:
DAEMON=/usr/local/bin/rrdcached
DAEMON_USER=librenms
DAEMON_GROUP=librenms
WRITE_THREADS=4
WRITE_TIMEOUT=3600
WRITE_JITTER=120
BASE_PATH=/usr/home/librenms/rrd/
JOURNAL_PATH=/var/db/rrdcached/journal/
PIDFILE=/var/run/rrdcached.pid
SOCKFILE=/var/run/rrdcached.sock
SOCKGROUP=librenms
BASE_OPTIONS="-B -F -R -L 0:42217"
Thank you for any assistance you may be able to give!