Hello Everyone,
I am new to Librenms.
There was an alert detected by Librenms on 04/28 at 11:23 am, but it appeared in Alert Summary on 04/29. Also, this alarm goes back well in the history of Librenms alerts dated 04/28. Would you please tell me what could be the possible reason for this ? Is there any setting I need to change in the config.php file or somewhere else ?
I have already read the documents available at [https://docs.librenms.org/Alerting/Introduction/] but couldn’t understand what could be the reason for this behavior.
You need to give more information. Such as a dump of the alert from the relevant database tables and anything else you think is relevant.
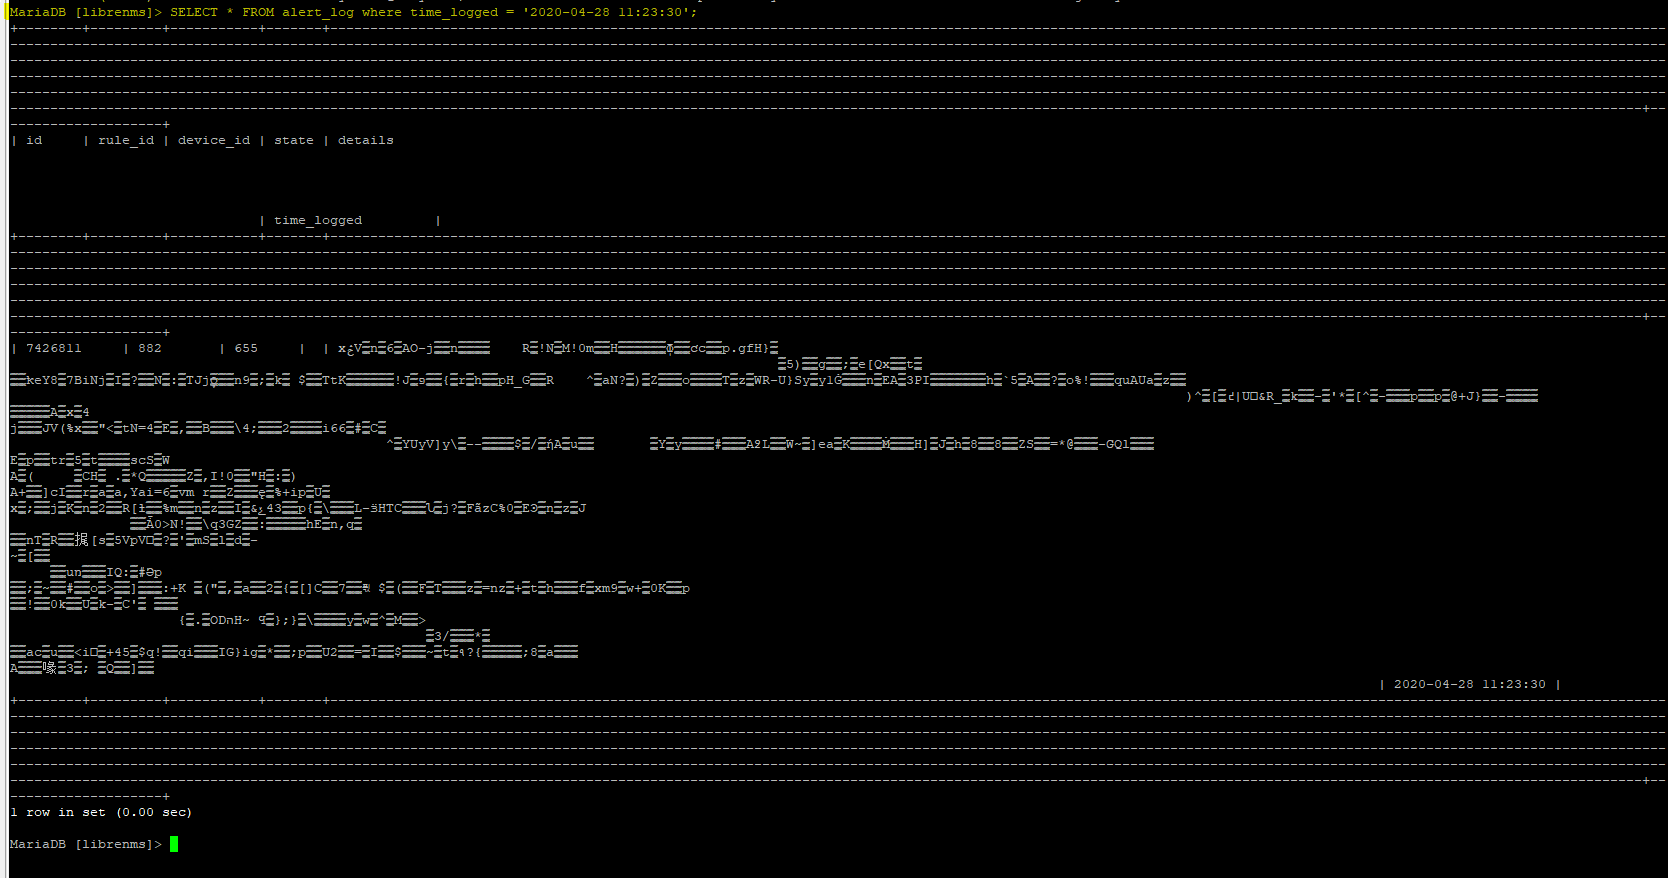
Below is the result of alert_log table for time_logged = ‘2020-04-28 11:23:30’ :
Here is config.php setting -
<?php
## Have a look in defaults.inc.php for examples of settings you can set here. DO NOT EDIT defaults.inc.php!
### Database config
$config['db_host'] = 'mysql';
$config['db_port'] = '3306';
$config['db_user'] = 'librenms';
$config['db_pass'] = 'password';
$config['db_name'] = 'librenms';
$config['db_socket'] = '';

// This is the user LibreNMS will run as
//Please ensure this user is created and has the correct permissions to your install
$config['user'] = 'librenms';

### This should *only* be set if you want to *force* a particular hostname/port
### It will prevent the web interface being usable form any other hostname
$config['base_url']        = "/";

### Enable this to use rrdcached. Be sure rrd_dir is within the rrdcached dir
### and that your web server has permission to talk to rrdcached.
#$config['rrdcached']    = "unix:/var/run/rrdcached.sock";

### Default community
$config['snmp']['community'] = array("public");

### Authentication Model
$config['auth_mechanism'] = "mysql"; # default, other options: ldap, http-auth
#$config['http_auth_guest'] = "guest"; # remember to configure this user if you use http-auth

### List of RFC1918 networks to allow scanning-based discovery
#$config['nets'][] = "10.0.0.0/8";
#$config['nets'][] = "172.16.0.0/12";
#$config['nets'][] = "192.168.0.0/16";

# Update configuration
#$config['update_channel'] = 'release';  # uncomment to follow the monthly release channel
$config['update'] = 0;  # uncomment to completely disable updates

# custom misc
$config['enable_billing'] = 1; # Enable Billing
$config['title_image'] = "images/custom/logo.png";
$config['allow_duplicate_sysName'] = true;

# custom collect
$config['fping_options']['timeout'] = 2000;
$config['fping_options']['count']   = 3;
$config['fping_options']['interval'] = 500;
$config['snmp']['timeout'] = 10;
$config['snmp']['retries'] = 3;
$config['snmp']['exec_timeout'] = 800;

# custom graph
$config['graph_types']['device']['junos_cp_sessions']['section'] = 'network';
$config['graph_types']['device']['junos_cp_sessions']['order'] = '0';
$config['graph_types']['device']['junos_cp_sessions']['descr'] = 'junos cp sessions';
$config['graph_types']['device']['junos_flow_sessions']['section'] = 'network';
$config['graph_types']['device']['junos_flow_sessions']['order'] = '0';
$config['graph_types']['device']['junos_flow_sessions']['descr'] = 'junos flow sessions';
$config['graph_types']['device']['junos_sessions_creation']['section'] = 'network';
$config['graph_types']['device']['junos_sessions_creation']['order'] = '0';
$config['graph_types']['device']['junos_sessions_creation']['descr'] = 'junos sessions creation';

# custom alert macros
$config['alert']['macros']['rule']['time_8am_to_6pm'] = 'NOW() BETWEEN DATE_FORMAT(NOW(), "%Y-%m-%d 08:00") AND DATE_FORMAT(NOW(), "%Y-%m-%d 18:00")';
$config['alert']['macros']['rule']['time_8am_to_10pm'] = 'NOW() BETWEEN DATE_FORMAT(NOW(), "%Y-%m-%d 08:00") AND DATE_FORMAT(NOW(), "%Y-%m-%d 22:00")';
$config['alert']['macros']['rule']['time_8am_to_11pm'] = 'NOW() BETWEEN DATE_FORMAT(NOW(), "%Y-%m-%d 08:00") AND DATE_FORMAT(NOW(), "%Y-%m-%d 23:00")';
$config['alert']['macros']['rule']['time_10am_to_10pm'] = 'NOW() BETWEEN DATE_FORMAT(NOW(), "%Y-%m-%d 10:00") AND DATE_FORMAT(NOW(), "%Y-%m-%d 22:00")';
$config['alert']['macros']['rule']['time_10am_to_11pm'] = 'NOW() BETWEEN DATE_FORMAT(NOW(), "%Y-%m-%d 10:00") AND DATE_FORMAT(NOW(), "%Y-%m-%d 23:00")';
$config['alert']['macros']['rule']['time_11am_to_10pm'] = 'NOW() BETWEEN DATE_FORMAT(NOW(), "%Y-%m-%d 11:00") AND DATE_FORMAT(NOW(), "%Y-%m-%d 22:00")';
$config['alert']['macros']['rule']['time_11am_to_11pm'] = 'NOW() BETWEEN DATE_FORMAT(NOW(), "%Y-%m-%d 11:00") AND DATE_FORMAT(NOW(), "%Y-%m-%d 23:00")';
$config['alert']['macros']['rule']['time_12am_to_00am'] = 'NOW() NOT BETWEEN DATE_FORMAT(NOW(), "%Y-%m-%d 00:00") AND DATE_FORMAT(NOW(), "%Y-%m-%d 12:00")';
$config['alert']['macros']['rule']['time_10am_to_01am'] = 'NOW() NOT BETWEEN DATE_FORMAT(NOW(), "%Y-%m-%d 01:00") AND DATE_FORMAT(NOW(), "%Y-%m-%d 12:00")';
$config['alert']['macros']['rule']['time_18am_to_00am'] = 'NOW() NOT BETWEEN DATE_FORMAT(NOW(), "%Y-%m-%d 00:00") AND DATE_FORMAT(NOW(), "%Y-%m-%d 18:00")';
$config['alert']['macros']['rule']['time_19am_to_01am'] = 'NOW() NOT BETWEEN DATE_FORMAT(NOW(), "%Y-%m-%d 01:00") AND DATE_FORMAT(NOW(), "%Y-%m-%d 19:00")';
$config['alert']['macros']['rule']['time_08am_to_02am'] = 'NOW() NOT BETWEEN DATE_FORMAT(NOW(), "%Y-%m-%d 02:00") AND DATE_FORMAT(NOW(), "%Y-%m-%d 08:00")';
$config['alert']['macros']['rule']['time_08am_to_01am'] = 'NOW() NOT BETWEEN DATE_FORMAT(NOW(), "%Y-%m-%d 01:00") AND DATE_FORMAT(NOW(), "%Y-%m-%d 08:00")';
Would you please help me with this issue, and tell me why this is happening ?
Below is the setting in config.pp -
# custom collect
$config['fping_options']['timeout'] = 2000;
$config['fping_options']['count']   = 3;
$config['fping_options']['interval'] = 500;
$config['snmp']['timeout'] = 10;
$config['snmp']['retries'] = 3;
$config['snmp']['exec_timeout'] = 800;
Can you get us the alertlog encoded as Base64 please?
You can also unzip it yourself and provide the JSON object it represents.
Is the alert just not showing in the WebUI or is it also not being transported (email etc)?