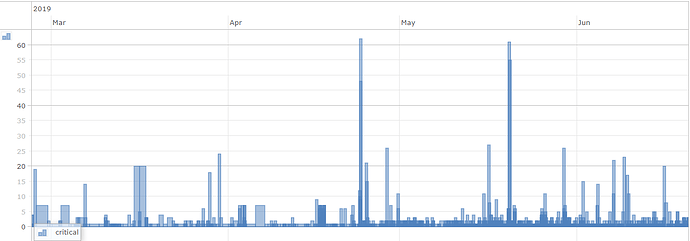
I need help to interpret Alert Statistics Graph. I need to know when and how long one device was down.
For example, in the attached graph, I don’t know what mean the number 60 in Y axis and in X axis no legend appears.
Can I create availability report for a device? how?
Thanks in advance.!!
====================================
Component | Version
--------- | -------
LibreNMS  | 1.52-54-g1a60c44eb
DB Schema | 2019_05_30_225937_device_groups_rewrite (135)
PHP       | 7.2.19-0ubuntu0.18.04.1
MySQL     | 10.1.40-MariaDB-0ubuntu0.18.04.1
RRDTool   | 1.7.0
SNMP      | NET-SNMP 5.7.3
====================================
[OK]    Composer Version: 1.8.6

[OK]    Dependencies up-to-date.

[OK]    Database connection successful

[OK]    Database schema correct
