All my graphs seem to be empty on my install. Think I followed all the directions properly. All other functions seem to be working. I can even see live stats on the graph at the bottom, but the graph doesn’t chart. Any ideas what to look at?
Also, output of “show rrd command” shows OK at the bottom. Not sure where to look next as I don’t see any errors in the log. The two devices that show up as taking too long to poll are something I need fixed, but all other devices are polling with no issues.
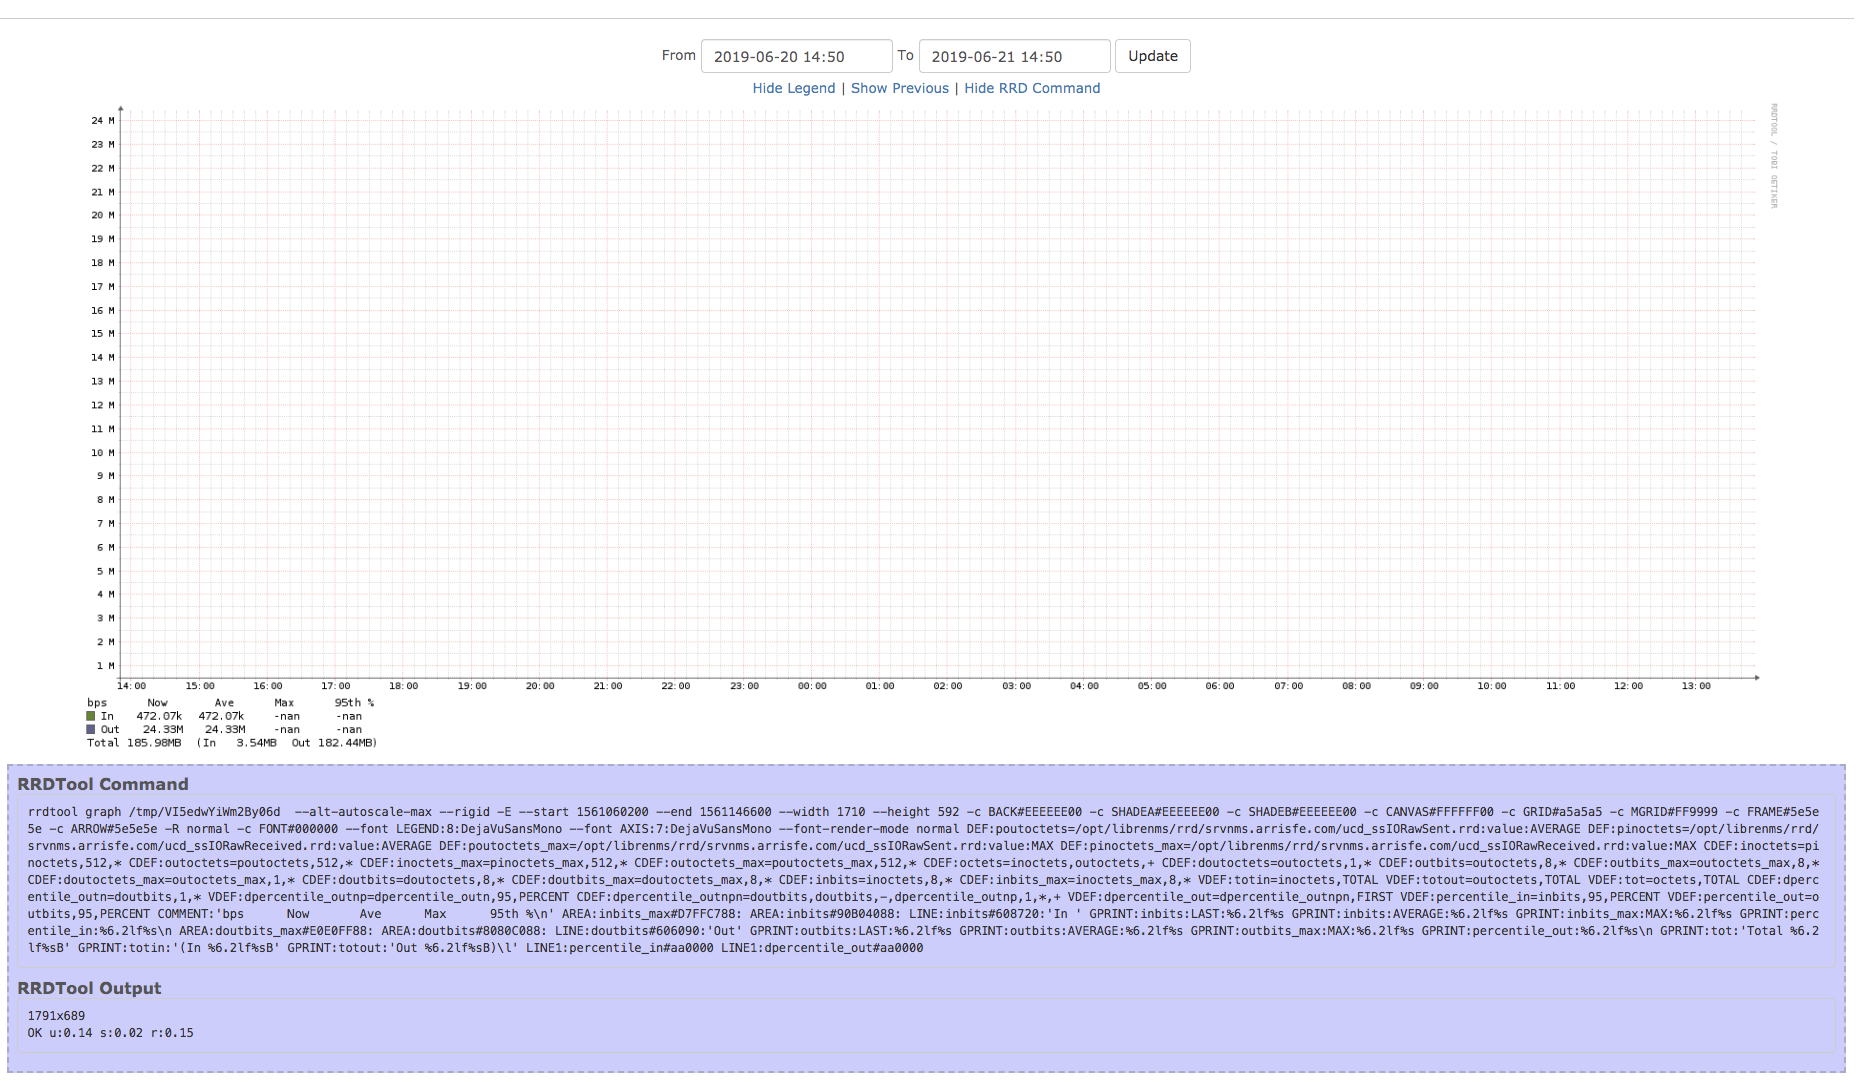
the device i listed in the previous response is the localhost and it responds properly according to the output, but it doesn’t graph.
The errors in the validate are for two hosts that take a while to respond. I can remove them from the system entirely if you think they are breaking the ability to graph for the entire system?
Yes, I’ve just disabled RRDcache and stopped the service as suggested. I have the same issue to a T. So I will update if this fixes things. Thanks Chas.
Yes, @Chas, i did this and graphing appeared to pick up on the localhost immediately. This could just be that it was a while of polling after reinstalling rrdcache, but now its disabled. It does not appear that other devices picked up to graphing so quickly either, but yes now after 20 or so minutes other devices are graphing now. I wanted to use rrdcached though. I wonder if this will be okay after a reboot and the service is restarted.