Sometime in the last few days, all Palo Alto device icons on the Availability Map are gray, instead of the usual red/green for up/down. If the device is up, it’s white “Up” on gray background. If the device is down, it’s white “Down” on gray background.
The border around the device shows the correct red/green color.
No other device types are exhibiting this.
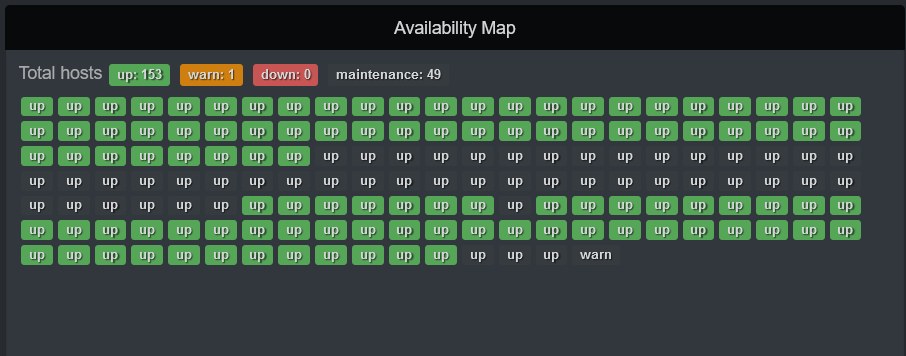
(all gray “up” devices in the image are Palo Alto firewalls)
===========================================
Component | Version
--------- | -------
LibreNMS  | 23.9.1-28-gaebe9ba93 (2023-10-03T01:05:43-07:00)
DB Schema | 2023_09_01_084057_application_new_defaults (259)
PHP       | 8.2.10
Python    | 3.8.10
Database  | MariaDB 10.3.38-MariaDB-0ubuntu0.20.04.1
RRDTool   | 1.7.2
SNMP      | 5.8
===========================================

[OK]    Composer Version: 2.6.4
[OK]    Dependencies up-to-date.
[OK]    Database connection successful
[OK]    Database Schema is current
[OK]    SQL Server meets minimum requirements
[OK]    lower_case_table_names is enabled
[OK]    MySQL engine is optimal
[OK]    Database and column collations are correct
[OK]    Database schema correct
[OK]    MySQl and PHP time match
[OK]    Active pollers found
[OK]    Dispatcher Service is enabled
[OK]    Locks are functional
[OK]    Python wrapper cron entry is not present
[OK]    Redis is unavailable
[OK]    rrdtool version ok
[OK]    Connected to rrdcached