Hi Folks,
Following last nights update I’m having a problem with the Proxmox App.
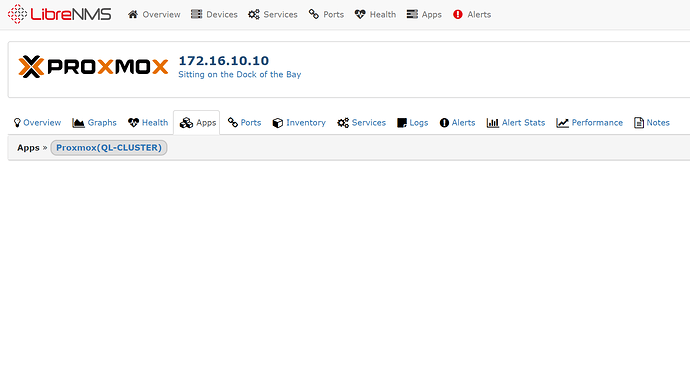
From the main menu if I choose ‘Apps/Proxmox’ I can still see my clusters and the VPS they are running. However hovering over a VPS displays nothing and clicking on a link results in a blank page.
If I look at the node server hosting the VPS, under APPS none of the VPS are now listed.
Any help much appreciated.
Cheers
Clear the cache in your browser
Thanks for the reply,
Sorry I should have said I’ve already tried clearing the cache. I also tried testing from a completely new client machine/browser that had not been used before. In both cases the results are the same, the page title appears followed by the cluster title then nothing.
Add /debug to your url and see if it gives any output
Ok from the Main Menu I choose Apps/Proxmox, I then select one of the listed VPS and add /debug to the end. This gives me a blank page with options for SQL and PHP on the bottom. Selecting either brings up a dialog.
SQL -> 0 total SQL queries run.
PHP -> 0 total PHP issues / errors.
Repeating for the Device/Apps tab returns the same.
Hmm, check logs/librenms.org and see if there are any errors in there after visiting the page.
Ok I refreshed/opened the offending pages a number of times then captured the last few lines from each logfile. Nothing jumps out, the last logs in the error log file were from the day before.
I also have a couple more LibreNMS installs, each is created from the published Centos 7 VMDK and each runs on and monitors a local ProxMox cluster. In all cases the same ‘issue’ has occurred so whatever has happened is consistent.
access.log :
172.16.10.112 - - [11/May/2018:13:03:47 +0000] “GET /apps/app=proxmox/instance=QL-CLUSTER/vmid=100/ HTTP/1.1” 200 27292 “http: // 172.16.10.38/apps/app=proxmox/” “Mozilla/5.0 (Windows NT 10.0; Win64; x64) AppleWebKit/537.36 (KHTML, like Gecko) Chrome/66.0.3359.139 Safari/537.36”
172.16.10.112 - - [11/May/2018:13:03:59 +0000] “GET /apps/app=proxmox/ HTTP/1.1” 200 28576 “http: // 172.16.10.38/apps/app=proxmox/instance=QL-CLUSTER/vmid=100/” “Mozilla/5.0 (Windows NT 10.0; Win64; x64) AppleWebKit/537.36 (KHTML, like Gecko) Chrome/66.0.3359.139 Safari/537.36”
172.16.10.112 - - [11/May/2018:13:04:03 +0000] “GET /apps/app=proxmox/instance=QL-CLUSTER/ HTTP/1.1” 200 27453 “http:// 172.16.10.38/apps/app=proxmox/” “Mozilla/5.0 (Windows NT 10.0; Win64; x64) AppleWebKit/537.36 (KHTML, like Gecko) Chrome/66.0.3359.139 Safari/537.36”
Error log, I see nothing relating to the above access requests:
2018/05/10 21:06:26 [error] 1002#0: *3568 FastCGI sent in stderr: “PHP message: PHP Notice: date_default_timezone_set(): Timezone ID ‘’ is invalid in /opt/librenms/vendor/laravel/framework/src/Illuminate/Foundation/Bootstrap/LoadConfiguration.php on line 49” while reading response header from upstream, client: 172.16.10.112, server: librenms. example. com, request: “GET /graphs/to=1525986300/id=237/type=port_bits/from=1525899900/ HTTP/1.1”, upstream: “fastcgi://unix:/var/run/php5-fpm.sock:”, host: “172.16.10.38”, referrer: “http:// 172.16.10.38/device/device=20/tab=port/port=237/”
Librenms.log:
`/opt/librenms/poller.php 10 2018-05-11 13:10:30 - 1 devices polled in 4.337 secs
/opt/librenms/poller.php 9 2018-05-11 13:10:34 - 1 devices polled in 4.273 secs
/opt/librenms/poller.php 11 2018-05-11 13:10:35 - 1 devices polled in 4.204 secs
That timezone notice has been fixed, your install isn’t up to date, run ./daily.sh
I think that’s a hang over from earlier. I’ve manually run daily.sh just in case but checking the log everything looks up-to-date:
LibreNMS\ComposerHelper::preInstall
Loading composer repositories with package information
Installing dependencies from lock file
Nothing to install or update
Generating autoload files
LibreNMS\ComposerHelper::postInstall
Illuminate\Foundation\ComposerScripts::postInstall
php artisan optimize
Generating optimized class loader
The compiled services file has been removed.
Returned: 0
Updated from 5fd81db to 54aa0a4
Returned: 0
Updating SQL-Schema
Returned: 0
Updating submodules
Returned: 0
Cleaning up DB
Refreshing alert rules queries
Clearing OS cache
Returned: 0
Fetching notifications
[ Fri, 11 May 2018 14:51:59 +0000 ] LibreNMS Notifications (28)
[ Fri, 11 May 2018 14:52:00 +0000 ] misc/notifications.rss (35)
[ Fri, 11 May 2018 14:52:00 +0000 ] Updating DB Done
Returned: 0
Caching PeeringDB data
Peering DB integration disabled
Returned: 0
Sorry for the delay in responding, too many things to do!
So last nights update fixed 90% of the ProxMox Issues, I say 90% as the graphs for the VPS are now shown correctly when you select one however the ‘hover’ pop up is still missing (perhaps its supposed to be).
So whatever the issue it seems it was a codebase one not an environment, unless someone wants to correct me.
Thanks
