When asking for help and support, please provide as much information as possible. This should include:
- Steps to reproduce an issue.
- The output of
./validate.php
If it’s an issue with the WebUI then please consider including a screenshot and the browser version you are using.
If you are having troubles with discovery/polling include the pastebin output of:
./discovery.php -h HOSTNAME -d | ./pbin.sh
./poller.php -h HOSTNAME -r -f -d | ./pbin.sh
If you need to post any text longer than a few lines, please use a pastebin service such as https://p.libren.ms using non-expiring pastes.
./validate.php:
===========================================
| Component | Version |
|---|---|
| LibreNMS | 24.2.0 (2024-03-01T10:55:24+00:00) |
| DB Schema | 2024_02_07_151845_custom_map_additions (290) |
| PHP | 8.2.16 |
| Python | 3.11.8 |
| Database | MariaDB 10.5.24-MariaDB-1:10.5.24+maria~ubu2004 |
| RRDTool | 1.8.0 |
| SNMP | 5.9.4 |
| =========================================== |
[OK] Installed from the official Docker image; no Composer required
[OK] Database connection successful
[OK] Database Schema is current
[OK] SQL Server meets minimum requirements
[OK] lower_case_table_names is enabled
[OK] MySQL engine is optimal
[OK] Database and column collations are correct
[OK] Database schema correct
[OK] MySQL and PHP time match
[OK] Active pollers found
[OK] Dispatcher Service is enabled
[OK] Locks are functional
[OK] No python wrapper pollers found
[OK] Redis is functional
[WARN] IPv6 is disabled on your server, you will not be able to add IPv6 devices.
[OK] rrd_dir is writable
[OK] rrdtool version ok
[WARN] Updates are managed through the official Docker image
RX/TX values for dBm don’t seem to be mapping correctly.
snmpwalk returns them as:
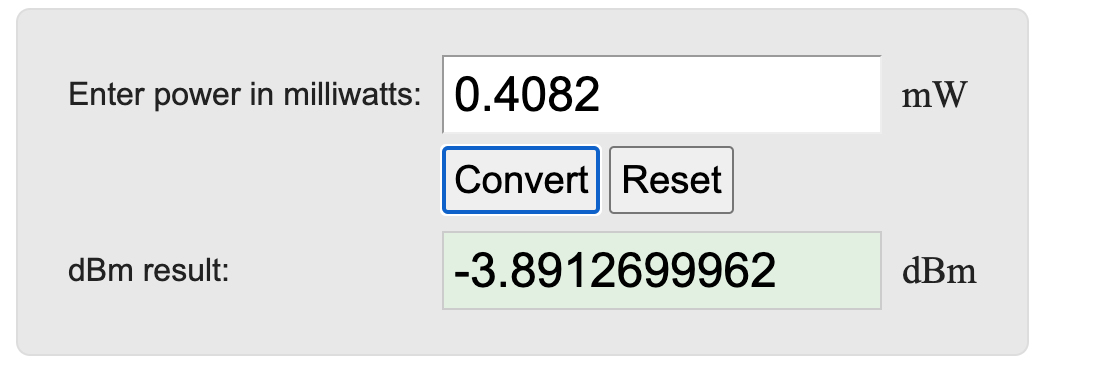
iso.3.6.1.2.1.99.1.1.1.4.100302213 = INTEGER: 4082
LibreNMS seems to agree:
“poller_type”: “snmp”,
“sensor_oid”: “.1.3.6.1.2.1.99.1.1.1.4.100302213”,
“sensor_index”: “100302213”,
“sensor_type”: “entity-sensor”,
“sensor_descr”: “DOM RX Power For Ethernet2”,
“group”: “SFPs”,
“sensor_divisor”: 1,
“sensor_multiplier”: 1,
“sensor_current”: 4082,
“sensor_limit”: 2.5,
“sensor_limit_warn”: 0.5,
“sensor_limit_low”: -16.4,
“sensor_limit_low_warn”: -14.4,
“sensor_alert”: 1"sensor_custom": “No”,
“entPhysicalIndex”: “100302213”,
However the conversion from reported values to expected dBm doesn’t seem to work. I am unsure if this is a scale error, or something else.
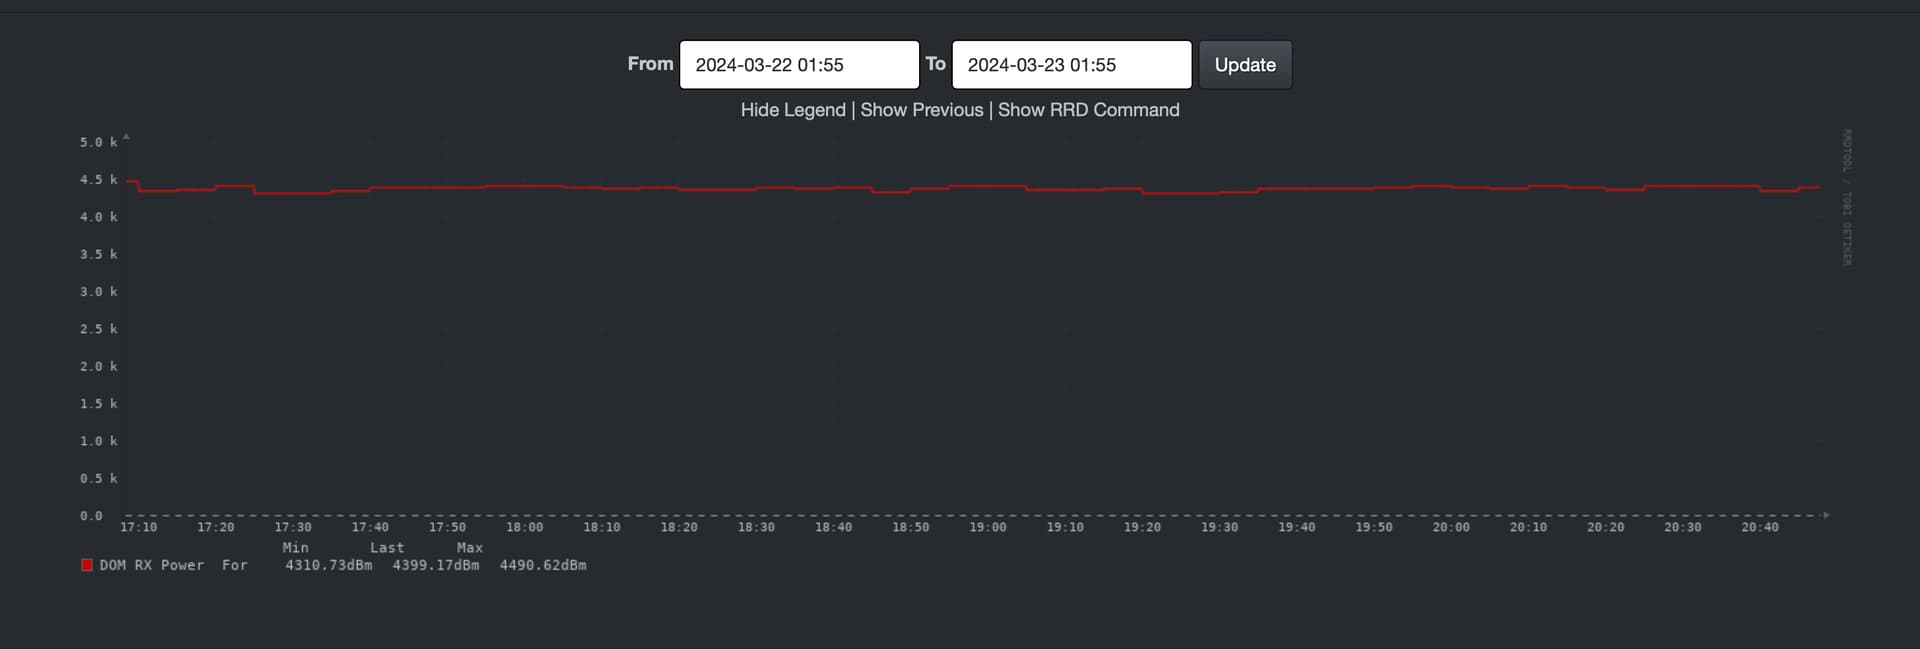
That “sensor_current” is populated pretty much as-is in the dBm:
DOM RX Power for Ethernet2;
Value: 4087 (dbm)
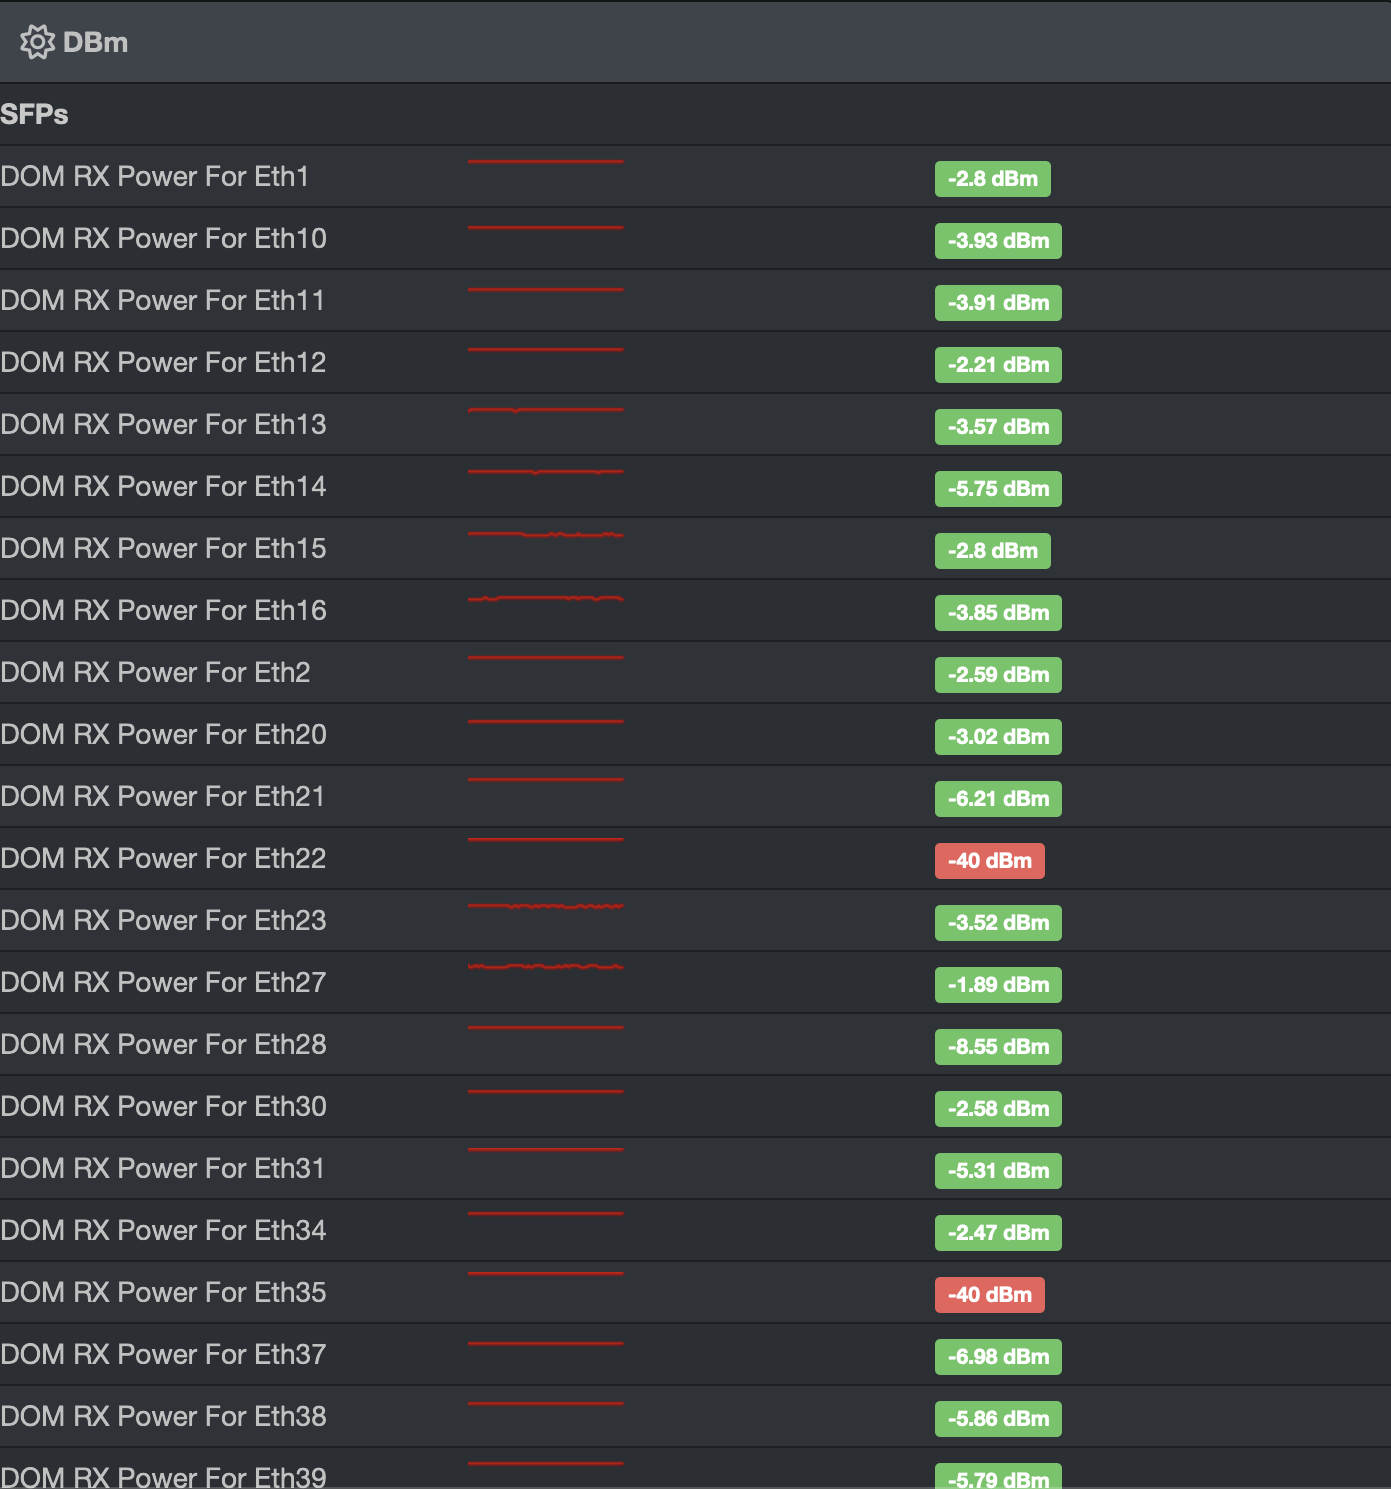
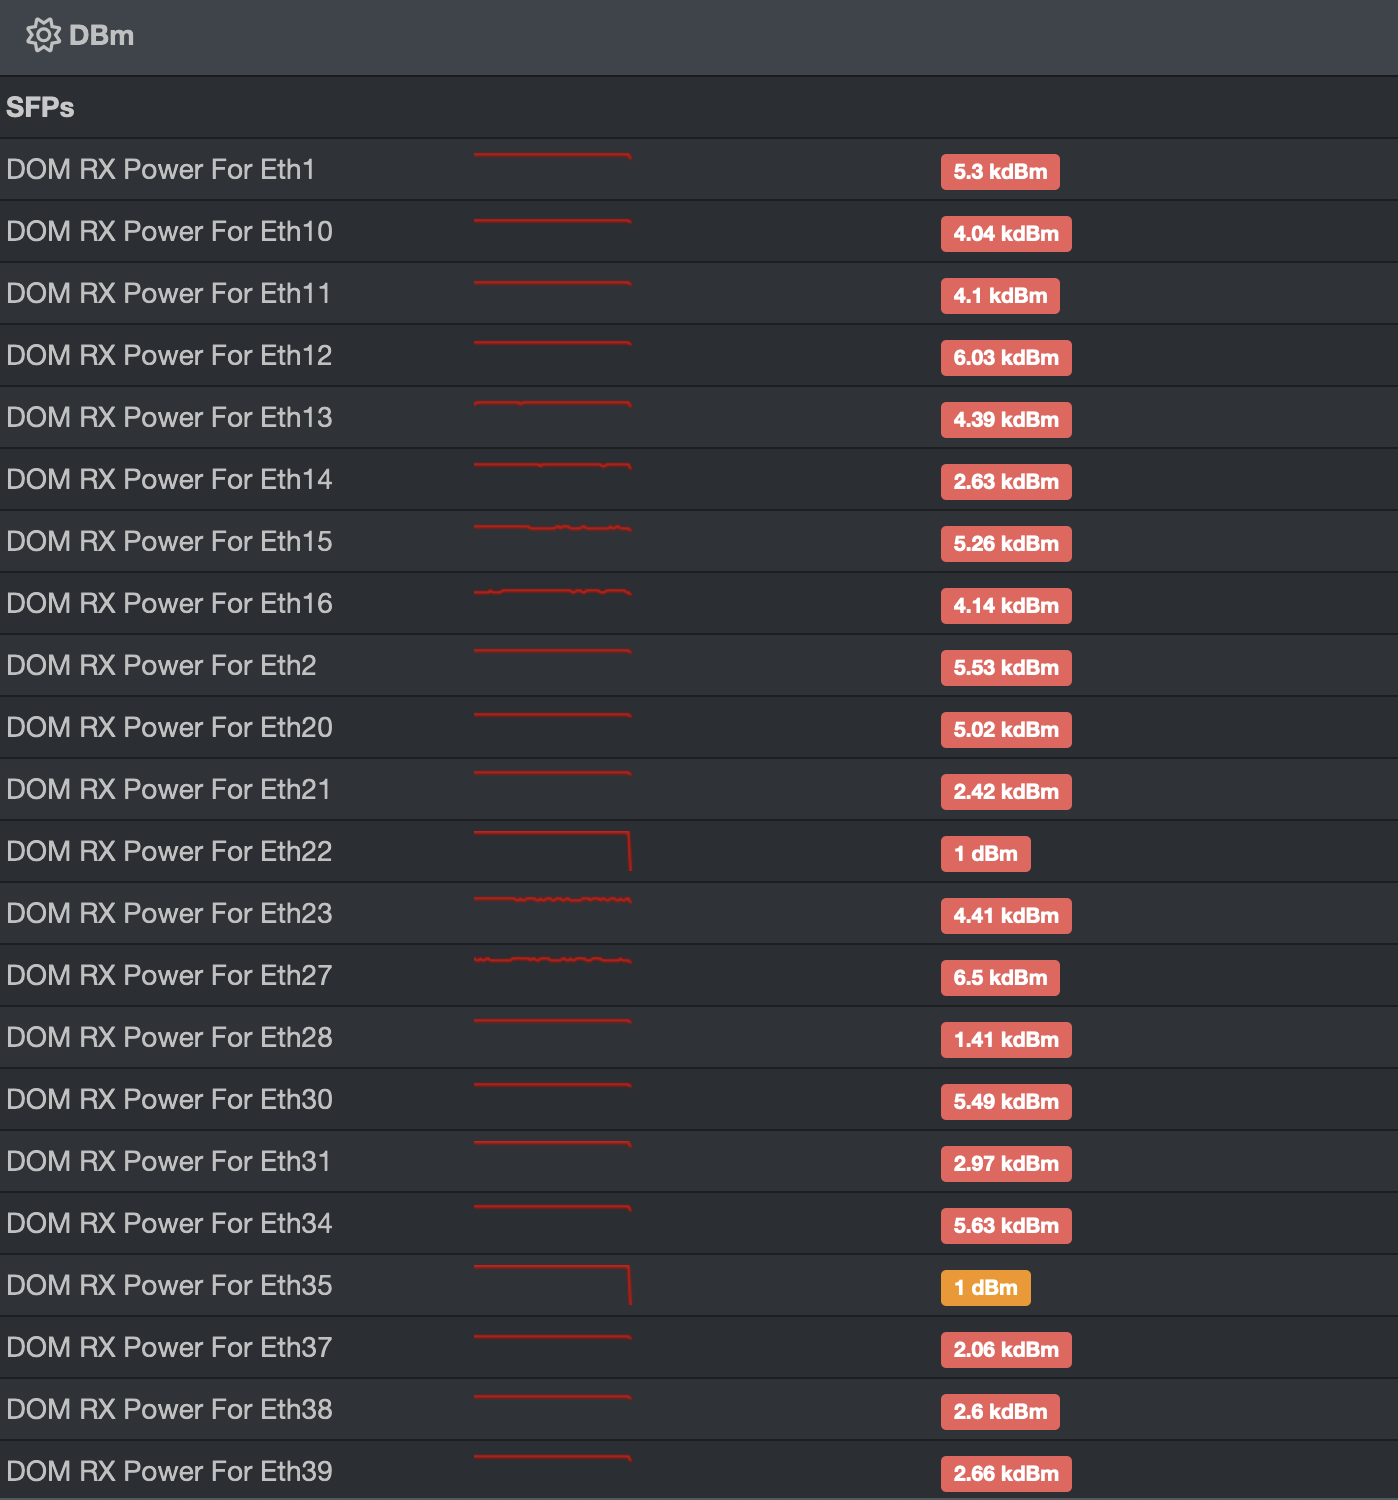
This causes alerts on all ports with transceiver details.
Limit values are pulled in correctly, but the actual power used is not.
                     High Alarm  High Warn   Low Alarm   Low Warn
       Rx Power      Threshold   Threshold   Threshold   Threshold
Port (dBm) (dBm) (dBm) (dBm) (dBm)
Et2 -3.89 2.50 0.50 -16.40 -14.40
Interestingly there is:
iso.3.6.1.2.1.99.1.1.1.6.100302213 = STRING: “mW”
Which maybe denotes the correct units for:
iso.3.6.1.2.1.99.1.1.1.4.100302213 = INTEGER: 4082
Hardware polled is: DCS-7280SR