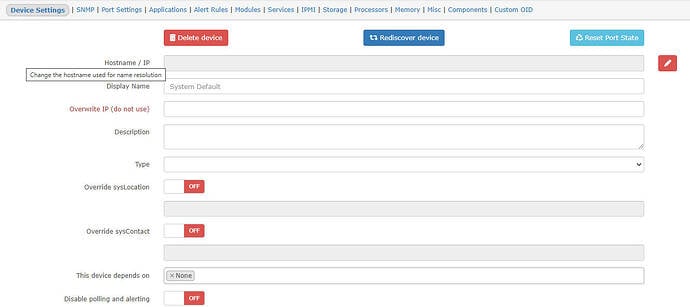
This is the output of command ./poller.php -h 303 -r -f -d | ./pbin.sh
[1;31mWarning: poller.php is deprecated![0m Use [1mlnms device:poll[0m instead.
SQL[[1;33mselect migration from migrations order by id desc limit 1 [0;33m[0m 0.51ms]
SQL[[1;33mselect count(*) as aggregate from migrations [0;33m[0m 0.38ms]
SQL[[1;33mselect version() [0;33m[0m 0.46ms]
===========================================
| Component |
Version |
| LibreNMS |
24.9.1-59-gaf15eabbb (2024-10-25T00:50:56-03:00) |
| DB Schema |
2024_10_06_002633_ports_vlans_table_add_port_id_index (301) |
| PHP |
8.3.12 |
| Python |
3.10.12 |
| Database |
MySQL 5.7.13-log |
| RRDTool |
1.7.2 |
| SNMP |
5.9.1 |
| =========================================== |
|
Updating os_def.cache
SQL[[1;33mselect device_id from devices where device_id = ? [0;33m[“303”][0m 0.65ms]
SQL[[1;33mselect * from devices where device_id = ? limit 1 [0;33m[303][0m 0.66ms]
Reporting disabled by user setting
Hostname:
ID: 303
OS: ping
IP:
Attempting to initialize OS: ping
OS initialized as Generic (ping)
SQL[[1;33mselect * from devices_attribs where devices_attribs.device_id = ? and devices_attribs.device_id is not null [0;33m[303][0m 0.54ms]
SQL[[1;33mselect * from device_outages where device_outages.device_id = ? and device_outages.device_id is not null and up_again is null order by going_down desc limit 1 [0;33m[303][0m 0.36ms]
Load poller module availability
Module enabled: Global + | OS | Device | Manual
SQL[[1;33mselect * from device_outages where device_outages.device_id = ? and device_outages.device_id is not null and up_again >= ? order by going_down asc [0;33m[303,1729790175][0m 0.62ms]
SQL[[1;33mselect * from availability where (device_id = ? and duration = ?) limit 1 [0;33m[303,86400][0m 0.97ms]
SQL[[1;33mupdate availability set availability_perc = ? where availability_id = ? [0;33m[15.636,1217][0m 0.55ms]
1 day : 15.636%
SQL[[1;33mselect * from device_outages where device_outages.device_id = ? and device_outages.device_id is not null and up_again >= ? order by going_down asc [0;33m[303,1729271775][0m 0.5ms]
SQL[[1;33mselect * from availability where (device_id = ? and duration = ?) limit 1 [0;33m[303,604800][0m 0.4ms]
SQL[[1;33mupdate availability set availability_perc = ? where availability_id = ? [0;33m[15.636,1218][0m 0.44ms]
1 week : 15.636%
SQL[[1;33mselect * from device_outages where device_outages.device_id = ? and device_outages.device_id is not null and up_again >= ? order by going_down asc [0;33m[303,1727284575][0m 0.44ms]
SQL[[1;33mselect * from availability where (device_id = ? and duration = ?) limit 1 [0;33m[303,2592000][0m 0.43ms]
SQL[[1;33mupdate availability set availability_perc = ? where availability_id = ? [0;33m[15.636,1219][0m 0.38ms]
1 month : 15.636%
SQL[[1;33mselect * from device_outages where device_outages.device_id = ? and device_outages.device_id is not null and up_again >= ? order by going_down asc [0;33m[303,1698340575][0m 0.4ms]
SQL[[1;33mselect * from availability where (device_id = ? and duration = ?) limit 1 [0;33m[303,31536000][0m 0.39ms]
SQL[[1;33mupdate availability set availability_perc = ? where availability_id = ? [0;33m[15.636,1220][0m 0.43ms]
1 year : 15.636%
SQL[[1;33mdelete from availability where availability.device_id = ? and availability.device_id is not null and availability_id not in (?, ?, ?, ?) [0;33m[303,1217,1218,1219,1220][0m 0.41ms]
[0;36mSNMP[0m: [0/0.00s] [1;33mMySQL[0m: [15/0.07s]
Runtime for poller module ‘availability’: 0.0120 seconds with 157048 bytes
Unload poller module availability
SQL[[1;33mselect * from device_graphs where device_graphs.device_id = ? and device_graphs.device_id is not null [0;33m[303][0m 0.43ms]
Enabled graphs (3): availability poller_modules_perf poller_perf
SQL[[1;33mupdate devices set last_polled = ?, last_polled_timetaken = ? where device_id = ? [0;33m[“2024-10-25 14:16:15”,0.021154165267944336,303][0m 0.5ms]
Polled (303) in 0.021 seconds <<<
Start Alerts
SQL[[1;33mselect device_groups.*, device_group_device.device_id as pivot_device_id, device_group_device.device_group_id as pivot_device_group_id from device_groups inner join device_group_device on device_groups.id = device_group_device.device_group_id where device_group_device.device_id = ? [0;33m[303][0m 0.41ms]
SQL[[1;33mselect exists(select * from alert_schedule where (start <= ? and end >= ? and (recurring = ? or (recurring = ? and ((time(start) < time xss=removed> ?) or (time(start) > time(end) and (time(start) <= ? or time(end) > ?))) and (recurring_day like ? or recurring_day is null)))) and (exists (select * from devices inner join alert_schedulables on devices.device_id = alert_schedulables.alert_schedulable_id where alert_schedule.schedule_id = alert_schedulables.schedule_id and alert_schedulables.alert_schedulable_type = ? and alert_schedulables.alert_schedulable_id = ?))) as exists [0;33m[“2024-10-25T17:16:15.615843Z”,“2024-10-25T17:16:15.615843Z”,0,1,“17:16:15”,“17:16:15”,“17:16:15”,“17:16:15”,“[45m%”,“device”,303][0m 0.67ms]
SQL[[1;33mselect * from devices where devices.device_id = ? limit 1 [0;33m[303][0m 0.54ms]
Disable alerting is set, Clearing active alerts and skipping alert rules check
SQL[[1;33mUPDATE alerts set state=?,alerted=?,open=? WHERE device_id = ? [0;33m[0,0,0,303][0m 0.39ms]
End Alerts (0.0074s)
[0;36mSNMP[0m [0/0.00s]:
[1;33mSQL[0m [61/0.27s]: Select[54/0.24s] Update[6/0.03s] Delete[1/0.00s]

