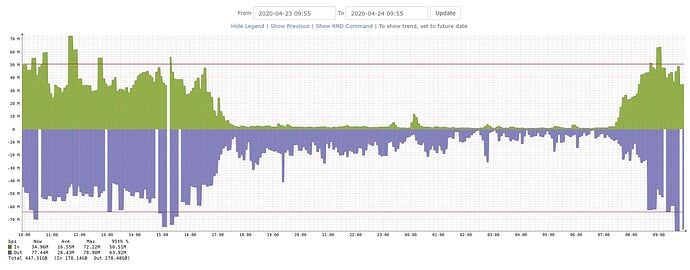
Been seeing this lately and it seems like when bandwidth go above 60Mbps that it’ll miss 5 minutes on the graph - see graph below
I’ve run the ./poller.php -h HOSTNAME -r -f -d | ./pbin.sh from my LibreNMS box and not sure what to look for the determine the issue of miss graphs
By the way I notice this only on bandwidth graphs of device behind my firewall and graphs on the firewall itself. I did check out librenms/FAQ.md at master · librenms/librenms · GitHub and have remove some unused poller modules. I also want to know how to achieve the following:
“If you poll a large number of devices / ports then it’s recommended to run a local recurisve dns server such as pdns-recursor.”
“Running RRDCached is also highly advised in larger installs but has benefits no matter the size.”
