Hi! Do you know what is dependence for graph service “ping”?
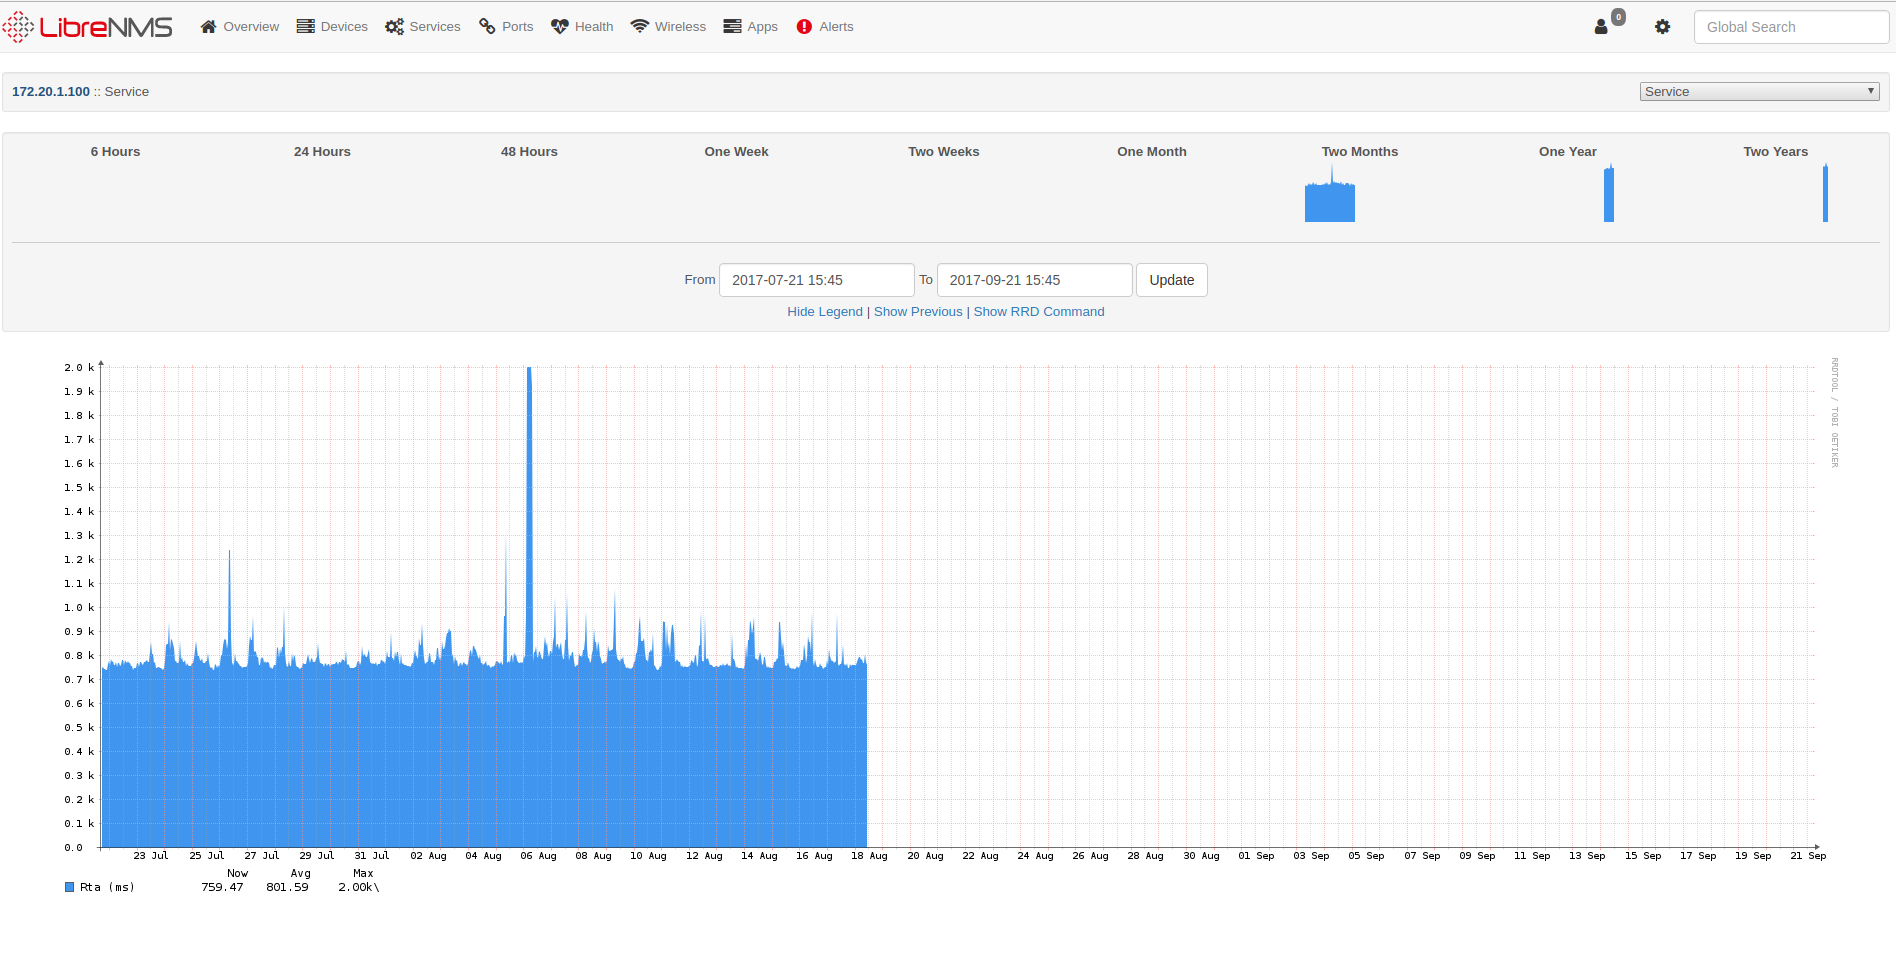
So, service “ping” works fine, but we lost graphs since 18th August
All hosts have same problem
This is using check_ping ?
It should use check_ping
file name is “check_ping” (from nagios)
if I use command in terminal:
./check_ping -H 172.18.1.1 -w 1000.0,20% -c 2000.0,60%
I see this:
PING OK - Packet loss = 0%, RTA = 173.12 ms|rta=173.119995ms;1000.000000;2000.000000;0.000000 pl=0%;20;60;0
that I use in Librenms:
code in file includes/services.inc.php
// if we have a script for this check, use it.
    $check_script = $config['install_dir'].'/includes/services/check_'.strtolower($service['service_type']).'.inc.php';
    if (is_file($check_script)) {
        include $check_script;
    }

   // If we do not have a cmd from the check script, build one.
    if ($check_cmd == "") {
        $check_cmd = $config['nagios_plugins'] . "/check_" . $service['service_type'] . " -H " . ($service['service_ip'] ? $service['service_ip'] : $service['hostname']);
        $check_cmd .= " " . $service['service_param'];
    }
have you tried without the -H argument? That’s already automatically passed by LibreNMS. Also, use code blocks for blocks of code,
```
#some code here
```
Sorry! I did not know about blocks for code. Thanks
So, you are right! I deleted -H argument, and it started showing me another report
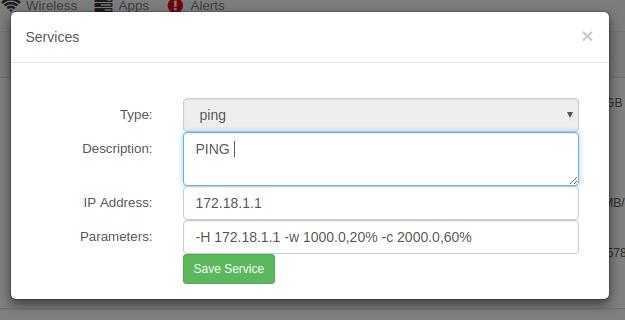
If I use in librenms service
-H 172.18.1.1 -w 1000.0,20% -c 2000.0,60%
I get it
172.18.1.1 is alive
And it does not give any numbers about ping in milliseconds. No numbers, no graphs…
When I use without -H
-w 1000.0,20% -c 2000.0,60%
I get it
PING OK - Packet loss = 0%, RTA = 822.32 ms
So, there are numbers, there are graphs!
Thanks a lot! Fixed
1 Like
I also stumbled upon this. I had created the ping service with wrong arguments (with the -H aaa.bbb.ccc.ddd option). When changing it as explained in this thread, the graphs kept showing no data. So I removed the whole service and recreated it from scratch and now all graphs (there are graphs for both RTA and PL) are shown correctly. I would be a great addition if the arguments for the specific service would be shown in the window as information.