Hello,
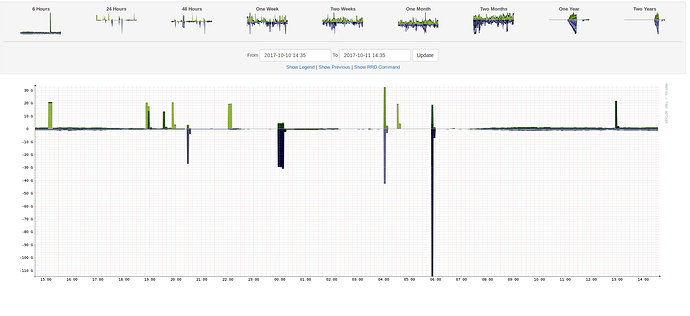
I am using LibreNMS and I have a problem with displaying graphics in the “Total Traffic” part.
This one shows me several Tb / s whereas it is false.
I start in LibreNMS and I do not know why this chart is wrong.
Would anyone be able to orient me to solve this problem?
For information I have several equipment (~ 20) from the same manufacturer (Brocade) and everything else is fine but not for this equipment.
Thanking you in advance.
Can post a screenshot of what you are looking at, please.
Ok thanks but the second link doesn’t work.
Ok thank you I look at this and I’ll make you a return on it. 
1 Like
Hello,
So following yesterday’s message here is what I did:
- I activated the “Tune all rrd port files to use max values” (cf: attachment).
- On my equipment I have “edit” then “Misc” and I activated the option “Enable RD Tune for all pors?”.
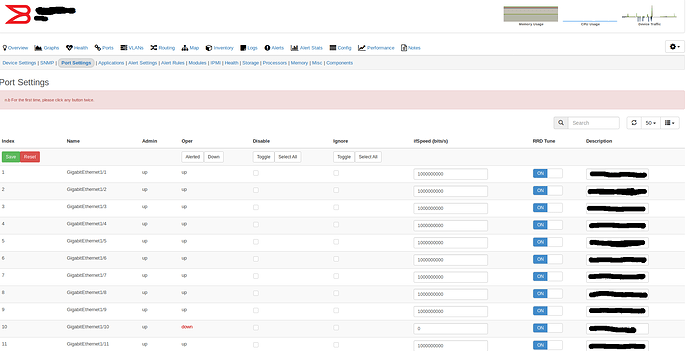
- Finally in “Port Settings” I activated on all my ethernet interfaces the “RRD Tune”.
However I always have the same worries in the graph “Total Traffic” I always have inconsistent values.
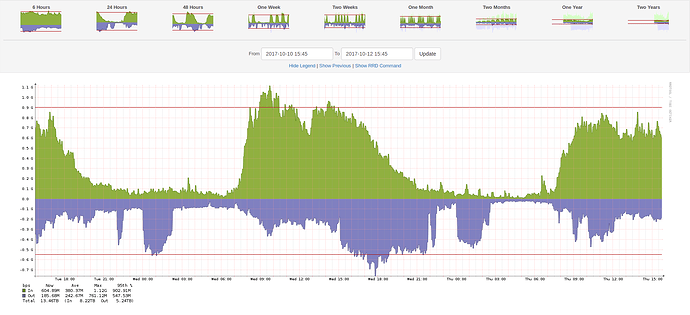
While the graphic of my uplink is good.
I admit to being lost and not to understand anything. : /
you need to run the scripts also…its in the doc
Hello,
Oops I forgot to run the script, I feel stupid … sorry.
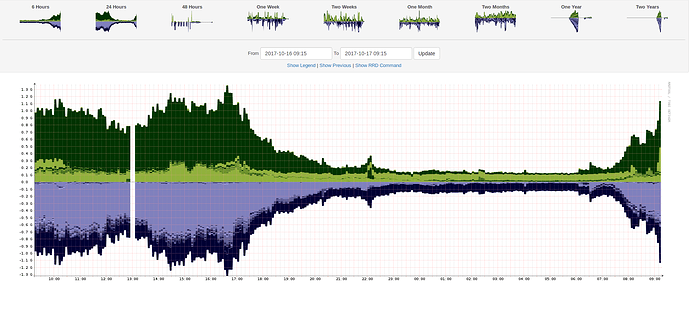
By launching the script it is better, I found an “overall traffic” corresponds to the value of my equipment.
Thank you for everything !
1 Like


