Hi,
I have LibreNMS monitoring a number of Cambium ePMP devices, and it appears the CPU usage for these devices is not being graphed correctly.
The OID returns CPU usage as an integer from 0-1000, divided by 10 to get 0-100% in 0.1% increments. From what I can see in the includes/polling/processors/cambium-cpu.inc.php file, this doesn’t appear to be a poller issue (as the value is retrieved and the file specifies dividing it by 10) but when I view the graph in the UI, the data seems to be scaling from 0-1 instead of 0-100%?
The graph looks like this;
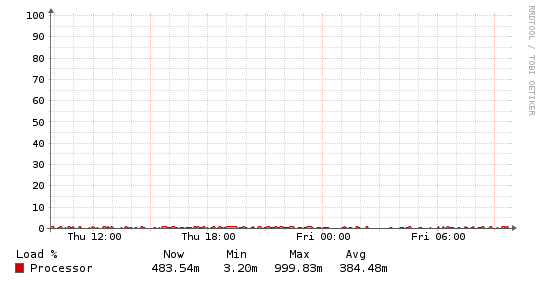
As you can see, it should be showing 48.3% CPU - but I get 483.54m, which is quite odd as this variable shouldn’t even have that many digits of precision…
Am I missing something obvious? I have discovery and poller runs behind those links on pastebin, but I suspect they’re not of much use.
This happens on two separate up-to-date LibreNMS instances, too. I had a brief look into the graphing code to see if I could see what’s going wrong or how to fix it, but I’ve not gotten anywhere - not enough PHP knowledge…
Output of validate.php;
====================================
Component | Version
--------- | -------
LibreNMS  | 1.30-73-g149857f
DB Schema | 204
PHP       | 7.0.22-0ubuntu0.16.04.1
MySQL     | 10.0.31-MariaDB-0ubuntu0.16.04.2
RRDTool   | 1.5.5
SNMP      | NET-SNMP 5.7.3
====================================

[OK]    Database connection successful
[OK]    Database schema correct
edit:
Quick follow-up, this appears to actually be an issue with RRD storage;
Here’s the RRDtool command being run for the graph;
rrdtool graph /tmp/PGkcifvosdxC8dRu
-l 0
-u 100
-E
--start 1502928000
--end 1503014400
--width 1728
--height 492
-c BACK#EEEEEE00
-c SHADEA#EEEEEE00
-c SHADEB#EEEEEE00
-c FONT#000000
-c CANVAS#FFFFFF00
-c GRID#a5a5a5
-c MGRID#FF9999
-c FRAME#5e5e5e
-c ARROW#5e5e5e
-R normal
--font LEGEND:8:DejaVuSansMono
--font AXIS:7:DejaVuSansMono
--font-render-mode normal
COMMENT:'Load %               Now      Min      Max     Avg\l'
DEF:ds0=/opt/librenms/rrd/HOSTNAME/processor-cambium-cpu-0.rrd:usage:AVERAGE
DEF:ds0min=/opt/librenms/rrd/HOSTNAME/processor-cambium-cpu-0.rrd:usage:MIN
DEF:ds0max=/opt/librenms/rrd/HOSTNAME/processor-cambium-cpu-0.rrd:usage:MAX
LINE1.25:ds0#CC0000:'Processor      '
AREA:ds0#CC000020
GPRINT:ds0:LAST:%5.2lf%s
GPRINT:ds0min:MIN:%5.2lf%s
GPRINT:ds0max:MAX:%5.2lf%s
GPRINT:ds0:AVERAGE:'%5.2lf%s\n'
HRULE:0#555555
If I go pull the latest update from that RRD;
# rrdtool info processor-cambium-cpu-0.rrd
filename = "processor-cambium-cpu-0.rrd"
rrd_version = "0003"
step = 300
last_update = 1503014704
header_size = 3080
ds[usage].index = 0
ds[usage].type = "GAUGE"
ds[usage].minimal_heartbeat = 600
ds[usage].min = -2.7300000000e+02
ds[usage].max = 1.0000000000e+03
ds[usage].last_ds = "0.18"
ds[usage].value = 8.6367204000e-01
ds[usage].unknown_sec = 0
So maybe it IS a poller/data storage issue?
