First time on the forum so apologies in advance if I miss something or get my formatting wrong…
My server details:
|Version |23.2.0-17-g2a53c49a5 - Thu Mar 09 2023 11:23:31 GMT+1300|
|---|---|
|Database Schema |2022_08_15_084507_add_rrd_type_to_wireless_sensors_table (248)|
|Web Server |nginx/1.18.0|
|PHP |8.1.16|
|Python |3.10.6|
|Database |MariaDB 10.6.12-MariaDB-0ubuntu0.22.04.1|
|Laravel |8.83.27|
|RRDtool |1.7.2|
What I’m trying to achieve?
- On one device I want to modify a graphs Y-axis format to better represent the value I wish to graph. I only want to modify this one device and the graph is from a Custom OID.
Why?
- I’m measuring air pressure which outputs the value in hPa, e.g. 1003 hPa, 995 hPa, etc. The graphed data looks odd with the current Y-axis formatting which is represent as 1.0 k, 1.1k, 1.2k etc.
I’d like to update my Y-axis to remove the decimal and show 1000’s.
See image:
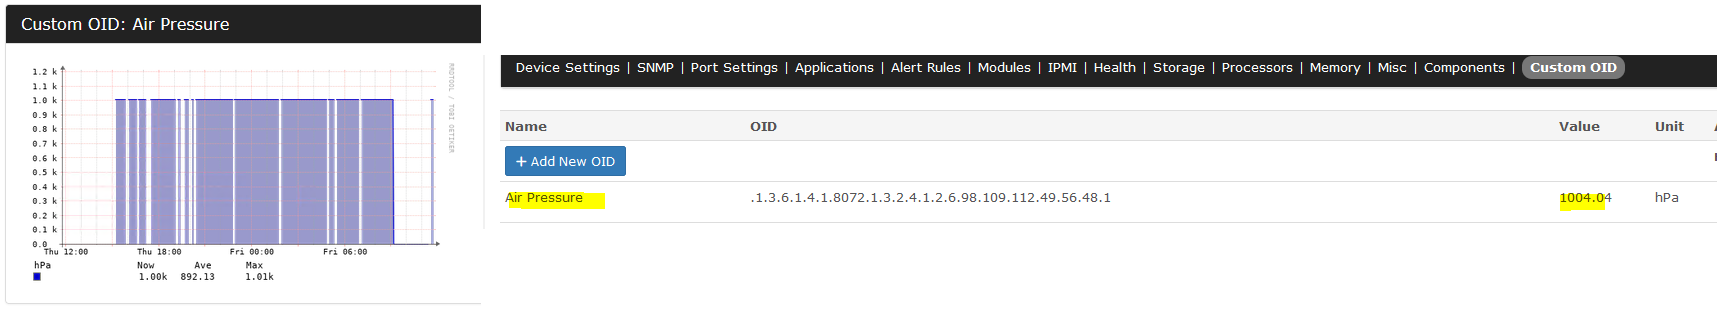
(ignore the breaks in graphing, I’m still playing around with things)
Hopefully I’ve explained it well enough but let me know what else you need if its possible!