Hi guys:
When accessing to alerts->Notifications , notifications are not properly listed:
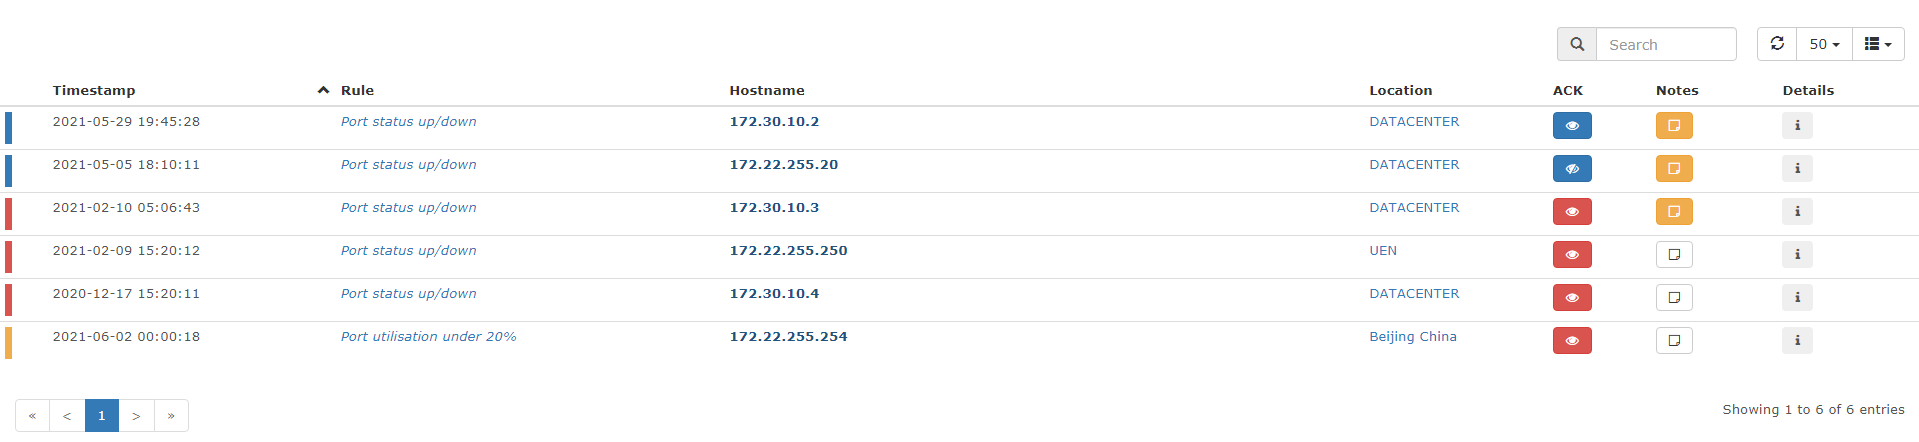
There are just a few notifications and they are not sorted , and they are very old.
How can I fix this section so I can use it and ack desired notifications.
This is my validate output:
Can you share a (redacted if needed) screenshot of what you see? You can sort it on the column headers, and you might find that the other alerts have resolved themselves and appear under alert history instead.
I’m still trying to come to terms with some alert tuning (previously been an extensive nagios/centreon user), but they are not sticky in that view unless they have a persisting state like an interface status down etc. They will go away if the event resolves, or if the alert rule only looks at a certain time period - for example syslog entries only within the last 5 minutes.
About your explanation , please confir if I understand correctly:
a Notifications section will not keep the historic of sended notifications.
b Notification section keeps only the notifications related with active alarms.
c While alarm is active you can see related notifications to ack them if you wish to.
I think you’ve understood it perfectly and that’s what I’ve noted in my testing.
People from a nagios background are probably used to seeing the notification emails rather than a dashboard of alerts. You can do those notifications via transports, so emails or a webhook etc. are sent on initial alert and then on recovery.
When thinking of the ‘alert’ and ‘notification’ as two separate things - that may help explain how it looks on the dashboard. An ‘Alert’ is a constantly ringing alarm that is actively an issue, and it goes quiet when there is no longer a need for it. The event that caused that alarm would have generated a detection and recovery notification which can be sent via whatever transports you configure.