Good day.
I have 1 web server, 1 db server, 1 rrd storage machine and few poller machines.
I use remote rrdcached. All graphs works fine, but…
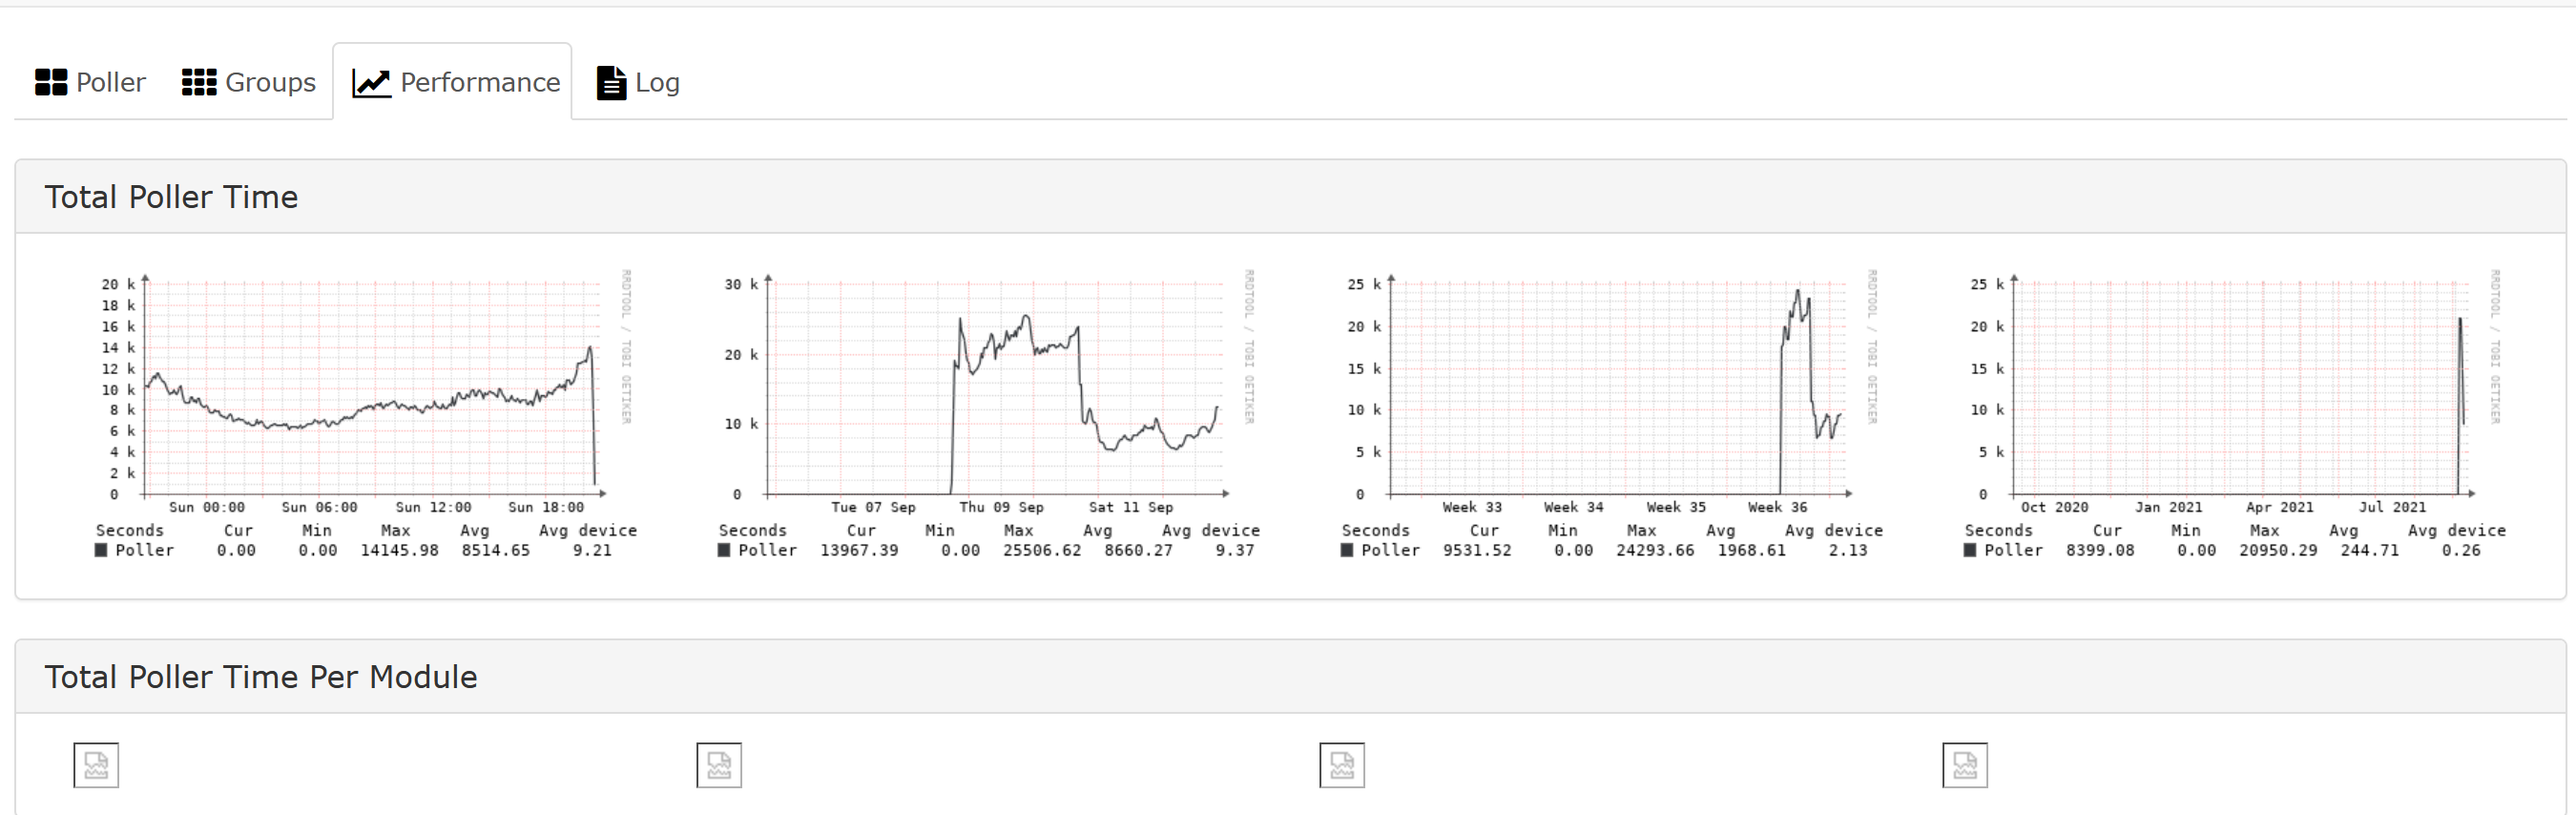
when I open the page https://librenms/poller/performance I see: in section “Total Poller Time” all graphs load for a veeery long time, in section “Total Poller Time Per Module” the graphs cannot load at all. I I browser debug tool I see 504 gateway timeout. I open a separate link to the graph, for example, https://librenms/graph.php?type=global_poller_modules_perf&legend=no&from=1526983800&to=1590055800&height=60&width=113 and I see 504 error again.
In shell at this time I see next:
service php-fpm status
Redirecting to /bin/systemctl status php-fpm.service
● php-fpm.service - The PHP FastCGI Process Manager
Loaded: loaded (/usr/lib/systemd/system/php-fpm.service; enabled; vendor preset: disabled)
Active: active (running) since Чт 2020-05-21 12:59:40 EEST; 13min ago
Main PID: 26510 (php-fpm)
Status: “Processes active: 7, idle: 18, Requests: 85, slow: 0, Traffic: 1.3req/sec”
CGroup: /system.slice/php-fpm.service
├─26510 php-fpm: master process (/etc/php-fpm.conf)
├─26511 php-fpm: pool www
├─26512 php-fpm: pool www
├─26513 php-fpm: pool www
├─26514 php-fpm: pool www
├─26515 php-fpm: pool www
├─26527 php-fpm: pool www
├─26573 php-fpm: pool www
├─26592 php-fpm: pool www
├─26593 php-fpm: pool www
├─26594 php-fpm: pool www
├─26595 php-fpm: pool www
├─26649 php-fpm: pool www
├─26662 php-fpm: pool www
├─26663 php-fpm: pool www
├─26664 php-fpm: pool www
├─26714 php-fpm: pool www
├─26741 php-fpm: pool www
├─26742 php-fpm: pool www
├─26873 php-fpm: pool www
├─26900 php-fpm: pool www
├─26901 php-fpm: pool www
├─26968 php-fpm: pool www
├─26979 php-fpm: pool www
├─26995 php-fpm: pool www
├─26996 php-fpm: pool www
├─27107 /usr/bin/rrdtool -
├─27108 /usr/bin/rrdtool -
├─27109 /usr/bin/rrdtool -
├─27110 /usr/bin/rrdtool -
├─27111 /usr/bin/rrdtool -
├─27112 /usr/bin/rrdtool -
├─27113 /usr/bin/rrdtool -
├─27114 /usr/bin/rrdtool -
├─27115 /usr/bin/rrdtool -
├─27116 /usr/bin/rrdtool -
├─27118 /usr/bin/rrdtool -
├─27119 /usr/bin/rrdtool -
├─27132 /usr/bin/rrdtool -
└─27133 /usr/bin/rrdtool -май 21 12:59:39 librenms.tenet.ua systemd[1]: Starting The PHP FastCGI Process Manager…
май 21 12:59:40 librenms.tenet.ua systemd[1]: Started The PHP FastCGI Process Manager.
and
ps ax|grep rrdtool
27107 ? R 0:05 /usr/bin/rrdtool -
27108 ? S 0:00 /usr/bin/rrdtool -
27109 ? R 0:05 /usr/bin/rrdtool -
27110 ? S 0:00 /usr/bin/rrdtool -
27111 ? R 0:05 /usr/bin/rrdtool -
27112 ? R 0:05 /usr/bin/rrdtool -
27113 ? S 0:00 /usr/bin/rrdtool -
27114 ? S 0:00 /usr/bin/rrdtool -
27115 ? R 0:05 /usr/bin/rrdtool -
27116 ? S 0:00 /usr/bin/rrdtool -
27118 ? R 0:05 /usr/bin/rrdtool -
27119 ? S 0:00 /usr/bin/rrdtool -
27132 ? S 0:03 /usr/bin/rrdtool -
27133 ? S 0:00 /usr/bin/rrdtool -
27198 pts/2 S+ 0:00 grep --color=auto rrdtool
I don’t know what’s going on and how fix it. Please help.
====================================
Component Version LibreNMS 1.63-108-g77b87cb DB Schema 2020_04_19_010532_eventlog_sensor_reference_cleanup (164) PHP 7.3.17 Python 3.6.8 MySQL 5.5.65-MariaDB RRDTool 1.7.1 SNMP NET-SNMP 5.7.2 ==================================== [OK] Composer Version: 1.10.6
[OK] Dependencies up-to-date.
[OK] Database connection successful
[OK] Database schema correct