Hello,
LibreNMS is not displaying graphs for certain ports namely sensor information. I have been trying to understand why this happens however I have not been successful.
On the Web UI’s Health/dBm tab, I have numerous sensors that are marked with a red flag, but it not obvious to me why they are not being graphed.
Is there a procedure I can follow, or logs I can read to debug this?
Thank you.
Hi,
Firstly please post the out put of validate.php
Here it is:
====================================
| Component |
Version |
| LibreNMS |
1.48.1-27-gc7c1ca2 |
| DB Schema |
2019_01_16_195644_add_vrf_id_and_bgpLocalAs (131) |
| PHP |
7.2.14 |
| MySQL |
10.3.12-MariaDB |
| RRDTool |
1.4.8 |
| SNMP |
NET-SNMP 5.7.2 |
====================================
[OK] Composer Version: 1.8.3
[OK] Dependencies up-to-date.
[OK] Database connection successful
[OK] Database schema correct
[FAIL] Some folders have incorrect file permissions, this may cause issues.
[FIX]:
sudo chown -R librenms:librenms /opt/librenms
sudo setfacl -d -m g::rwx /opt/librenms/rrd /opt/librenms/logs /opt/librenms/bootstrap/cache/ /opt/librenms/storage/
sudo chmod -R ug=rwX /opt/librenms/rrd /opt/librenms/logs /opt/librenms/bootstrap/cache/ /opt/librenms/storage/
Files:
/opt/librenms/storage/framework/views/950622515f28b1cb1943b6d9d65ab40c
You need to run those fixes
I already did, and I already had a few times in the past.
Still many ports do not show any graphs.
Thanks.
Run ./poller.php -d -h affectedhost -m sensors and check/pbin the output.
You can use http://p.libren.ms
Here it is,
https://p.libren.ms/view/6a2fb7e6
I believe I pasted it twice (first time using this).
Thanks
We are trying to help you I’m not sure what’s with all I have already comments.
I’m sorry I don’t understand what you mean by this
Please disregard the first paste, this is the correct one:
https://p.libren.ms/view/2857ec20
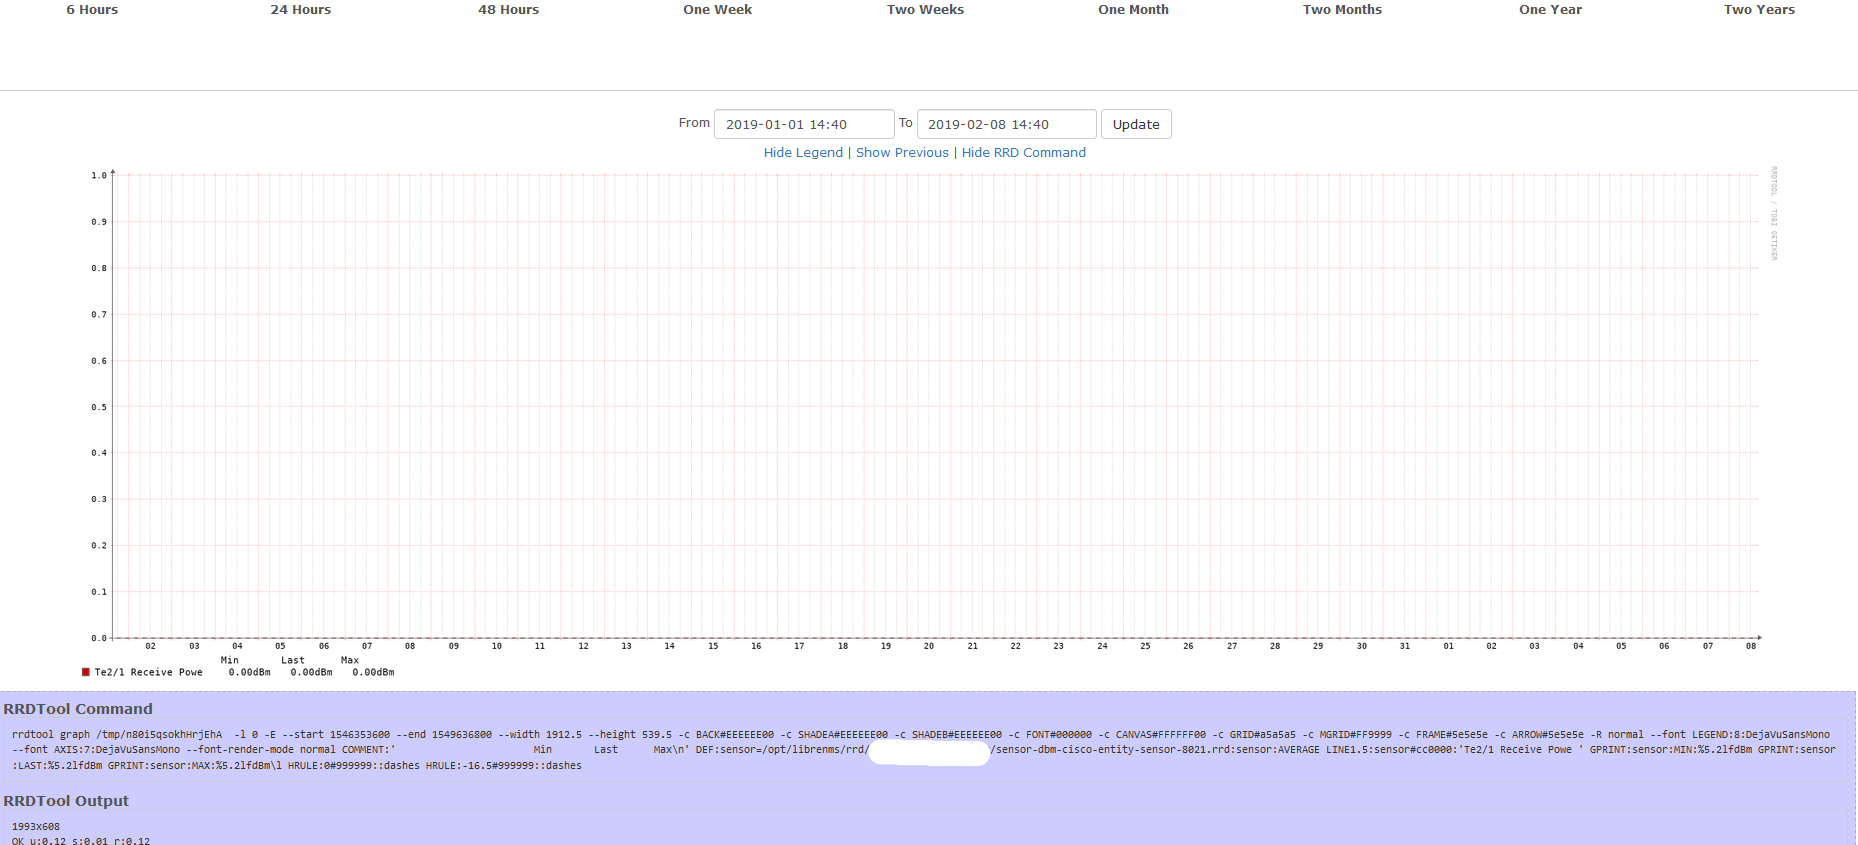
Click into the graph with issues and click the “show command” link.
Here it is:
RRDTool Command
rrdtool graph /tmp/sK9pWy891MwhaqQg -l 0 -E --start 1549550400 --end 1549636800 --width 1929.6 --height 539.5 -c BACK#EEEEEE00 -c SHADEA#EEEEEE00 -c SHADEB#EEEEEE00 -c FONT#000000 -c CANVAS#FFFFFF00 -c GRID#a5a5a5 -c MGRID#FF9999 -c FRAME#5e5e5e -c ARROW#5e5e5e -R normal --font LEGEND:8:DejaVuSansMono --font AXIS:7:DejaVuSansMono --font-render-mode normal COMMENT:’ Min Last Max\n’ DEF:sensor=/opt/librenms/rrd/hostname.private/sensor-dbm-cisco-entity-sensor-8021.rrd:sensor:AVERAGE LINE1.5:sensor#cc0000:'Te2/1 Receive Powe ’ GPRINT:sensor:MIN:%5.2lfdBm GPRINT:sensor:LAST:%5.2lfdBm GPRINT:sensor:MAX:%5.2lfdBm\l HRULE:0#999999::dashes HRULE:-16.5#999999::dashes
RRDTool Output
2010x608
OK u:0.11 s:0.01 r:0.11
looks correct what does the graph look like? (screenshot)
The graph only contains a scale from zero to one and the time scale, no data whatsoever, for any interval of time. Would you still like to see it?
Thanks
Everything is working correctly.
The device reports 0 for that sensor:
.*.*.*.1.4.8021 = 0 (which is actually .1.3.6.1.4.1.9.9.91.1.1.1.1.4.8021 = 0)
So this would be an SNMP configuration problem on the device side?
Either that or the SFP hardware doesn’t give the data.
It’s probably a configuration problem then, we have that same SFP on a different device and the graphs work perfectly.
Thanks for the help