I’m in the process of migrate an instance of librenms to a new server and I’m testing the polling of some devices to see how they will work out.
I am going to use three servers, two of them will have a polling time of 5 minutes, and the last one will have a polling time of ten minutes, it will do the polling on some slow devices, with a lot of ports.
On this server i was polling a Palo Alto Box (PA-3050), without polling the ports and with a polling time of 5 minutes, it was working ok, I changed the polling time to 10 minutes and now I have gaps in the graphics, I already changed the rrd step in the config.php and ran the rrdstep.php script, but I still have gaps.
What can I do to do not have those gaps? The device is being polled in less than five minutes.
No change, it still does not show some pollings and give me gaps.
In the log file I have the information that the device was polled.
/opt/librenms/discovery.php new 2017-12-04 10:00:02 - 0 devices discovered in 0.232 secs
/opt/librenms/poller.php 14 2017-12-04 10:01:11 - 1 devices polled in 69.55 secs
/opt/librenms/discovery.php new 2017-12-04 10:10:01 - 0 devices discovered in 0.001 secs
/opt/librenms/poller.php 14 2017-12-04 10:11:37 - 1 devices polled in 95.84 secs
/opt/librenms/discovery.php new 2017-12-04 10:20:01 - 0 devices discovered in 0.001 secs
/opt/librenms/poller.php 14 2017-12-04 10:21:35 - 1 devices polled in 93.41 secs
/opt/librenms/discovery.php new 2017-12-04 10:30:01 - 0 devices discovered in 0.001 secs
/opt/librenms/poller.php 14 2017-12-04 10:31:22 - 1 devices polled in 81.35 secs
/opt/librenms/discovery.php new 2017-12-04 10:40:02 - 0 devices discovered in 0.009 secs
/opt/librenms/poller.php 14 2017-12-04 10:41:31 - 1 devices polled in 89.22 secs
/opt/librenms/discovery.php new 2017-12-04 10:50:01 - 0 devices discovered in 0.001 secs
/opt/librenms/poller.php 14 2017-12-04 10:51:49 - 1 devices polled in 108.5 secs
/opt/librenms/discovery.php new 2017-12-04 11:00:01 - 0 devices discovered in 0.001 secs
/opt/librenms/poller.php 14 2017-12-04 11:01:54 - 1 devices polled in 112.2 secs
/opt/librenms/discovery.php new 2017-12-04 11:10:01 - 0 devices discovered in 0.012 secs
/opt/librenms/poller.php 14 2017-12-04 11:12:04 - 1 devices polled in 122.7 secs
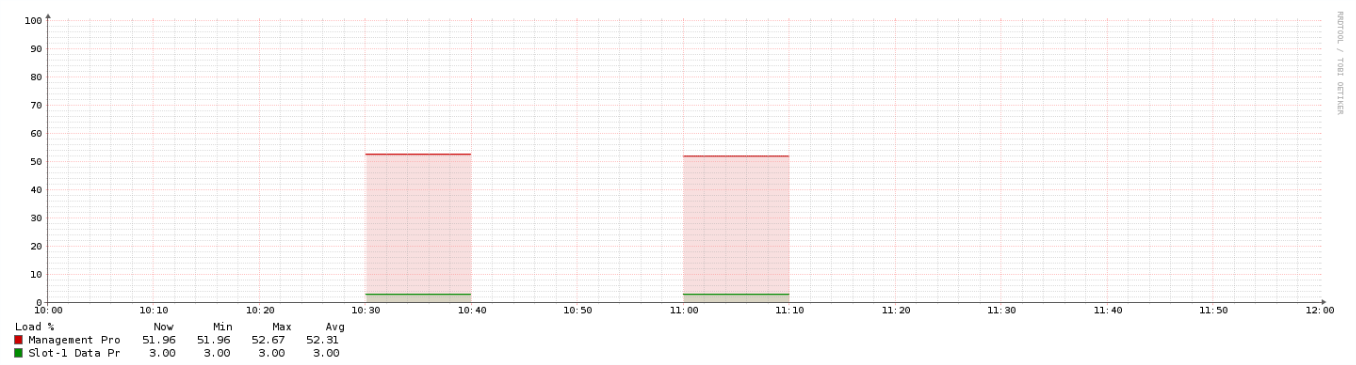
But some of those polling does not show in the rrd, for example, the polled on 10:41 and 10:51, does not appear in the graphics, which gives me the gap.
Are you sure polling is completing within 10 minutes in the first place?
You should also set the heartbeat value as well - have you done that, If so I’m guessing it’s set to 1200 seconds which in part is the length of time between those gaps. I’ve never tested longer time between polls as most people want to go the other way.
TL;DR - rrdtool was doing exactly what it was told and we were graphing the space between the polling and heartbeat (dead air).
This solution also fixes NaN or empty graphs. Had the issue where a blind adjustment from the default 300 seconds caused empty graphs, YET rrdtool was running flawlessly ( inside of ~/rrd/ running the rrdtool command resulted in OK with the output values). The timing and heartbeat, in our case, were exactly off to produce gaps that were the graph. All that said, the thing that kept us digging is that we were using InfluxDB → Graphana and our dashboards were all still fully functional. We updated the values to be double on the heartbeat and then issued the ./scripts/rrdstep.php -h all command