I recently installed librenms on centos 7 with php 7.2. I’m monitoring some network device as switch, router and firewall, all works very well, but I have some doubts on checkpoint’s network interface graph.
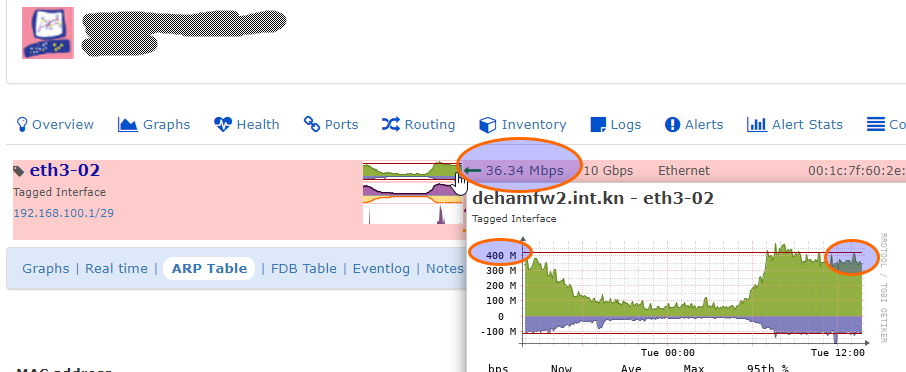
I have 2 firewall checkpoint R80.10, librenms detect them without issues, but graphs of interface not use the correct measure. The graph give me an avarage of 40Mbps but should be about 400Mbps.
I analyzed it with the command cpview on gaia os.
Maybe it’s acquire the data in bytes and show in graph as bits without conversion.
I tried to analize the source code without success.
Is there a solution?
Thank you for your suggestions…
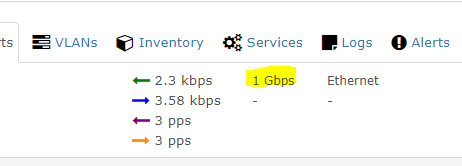
As you can see from the picture the normal graphs are perfectly fine also values in normal size graphs, but not the values which are shown for example if I click on Ports and look on the “Traffic” column.
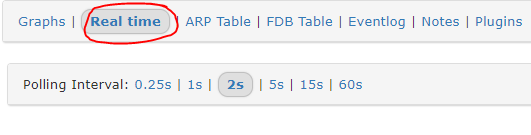
Also the realtime graph of the checkpoint interfaces show wrong values looks for me like a wrong ratio or multiplier. I have a lot of other devices (for example from cisco or other vendors) inside librenms - they are all fine and show the correct values. Only the checkpoint values are partially wrong.
As I said if I click on the interface graphs the values are correct and bigger graphs are also shown correct.
Would be very happy to get a hint where to look into this closer.
Yes, I do, in my picture the bigger graph and it’s values are correct but not the value at the top of the graph in the big circle.
No, that are total different numbers.
Yes, speed is set correct. I tried also to change the speed in the port settings of the devices but the values still didn’t match. (I changed the speed back to the correct value).