or did you mean with device id ?
of course, you need to add your -h <device_id>
Summary
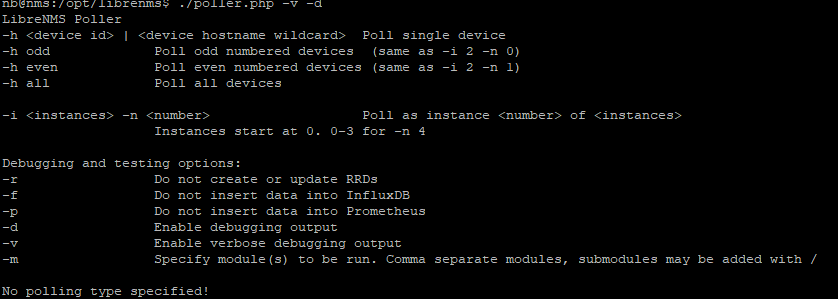
root@nms:/opt/librenms# ./poller.php -d -h 1 -m processors
LibreNMS Poller
SQL[select migration from migrations order by id desc limit 1 0.24ms]
SQL[select count(*) as aggregate from migrations limit 1 0.14ms]
SQL[SELECT version() 0.13ms]
===================================
Version info:
Commit SHA: f5209332b57005ba627852bae5e1568ed55a5eb2
Commit Date: 1553026589
DB Schema: 2019_02_10_220000_add_dates_to_fdb (132)
PHP: 7.2.15-0ubuntu0.18.04.1
MySQL: 10.1.38-MariaDB-0ubuntu0.18.04.1
RRDTool: 1.7.0
SNMP: NET-SNMP 5.7.3
==================================DEBUG!
Updating os_def.cache…
Done
Override poller modules: processors
Starting polling run:
SQL[SELECT * FROM devices WHERE disabled = 0 AND device_id = 1 ORDER BY device_id ASC 5.59ms]
SQL[SELECT * FROM devices_attribs WHERE device_id = ? [1] 0.16ms]
Hostname: 192.168.1.111
Device ID: 1
OS: ciscosb
Warning: inet_pton(): Unrecognized address in /opt/librenms/includes/polling/functions.inc.php on line 251
[FPING] /usr/bin/fping -e -q -c 3 -p 500 -t 500 192.168.1.111
array (
‘xmt’ => ‘3’,
‘rcv’ => ‘3’,
‘loss’ => ‘0’,
‘min’ => ‘1.51’,
‘max’ => ‘1.56’,
‘avg’ => ‘1.52’,
‘exitcode’ => 0,
)
SQL[INSERT IGNORE INTO device_perf (xmt,rcv,loss,min,max,avg,device_id,timestamp,debug) VALUES (:xmt,:rcv,:loss,:min,:max,:avg,:device_id,NOW(),:debug) {“xmt”:“3”,“rcv”:“3”,“loss”:“0”,“min”:“1.51”,“max”:“1.56”,“avg”:“1.52”,“device_id”:1,“debug”:“”} 2.08ms]
SNMP Check response code: 0
Modules status: Global+
OS
Device
Load poller module core
SNMP[‘/usr/bin/snmpget’ ‘-v2c’ ‘-c’ ‘COMMUNITY’ ‘-OQnUt’ ‘-m’ ‘SNMPv2-MIB’ ‘-M’ ‘/opt/librenms/mibs:/opt/librenms/mibs/cisco’ ‘udp:HOSTNAME:161’ ‘sysUpTime.0’ ‘sysLocation.0’ ‘sysContact.0’ ‘sysName.0’ ‘sysObjectID.0’ ‘sysDescr.0’]
...0 = 424671100
...0 =
...0 =
...0 = SG300-52
...0 = ...*
...0 = SG300-52 52-Port Gigabit Managed Switch
SNMP[‘/usr/bin/snmpget’ ‘-v2c’ ‘-c’ ‘COMMUNITY’ ‘-OQnUst’ ‘-m’ ‘HOST-RESOURCES-MIB:SNMP-FRAMEWORK-MIB’ ‘-M’ ‘/opt/librenms/mibs:/opt/librenms/mibs/cisco’ ‘udp:HOSTNAME:161’ ‘snmpEngineTime.0’ ‘hrSystemUptime.0’]
snmpEngineTime.0 = 3456668
hrSystemUptime.0 = No Such Object available on this agent at this OID
Uptime seconds: 4246711
RRD[update /opt/librenms/rrd/192.168.1.111/uptime.rrd N:4246711]
Uptime: 49 days 3 hours 38 minutes 31 seconds
SQL[select * from locations where (location = ?) limit 1 [“”] 0.26ms]
Runtime for poller module ‘core’: 0.0545 seconds with 168296 bytes
SNMP: [2/0.05s] MySQL: [0/0.00s] RRD: [1/0.00s]
Unload poller module core
RRD[update /opt/librenms/rrd/192.168.1.111/poller-perf-core.rrd N:0.054540157318115]
Modules status: Global+
OS
Device
Load poller module processors
Attempting to initialize OS: ciscosb
OS initialized as Generic
SQL[SELECT * FROM processors WHERE device_id=? [1] 0.42ms]
SNMP[‘/usr/bin/snmpget’ ‘-v2c’ ‘-c’ ‘COMMUNITY’ ‘-OUQn’ ‘-M’ ‘/opt/librenms/mibs:/opt/librenms/mibs/cisco’ ‘udp:HOSTNAME:161’ ‘.1.3.6.1.4.1.9.6.1.101.1.8.0’]
...*.0 = 17
array (
‘.1.3.6.1.4.1.9.6.1.101.1.8.0’ => ‘17’,
)
17%
RRD[update /opt/librenms/rrd/192.168.1.111/processor-ciscosb-0.rrd N:17]
SQL[UPDATE processors set processor_usage=? WHERE processor_id = ? [17,1] 1.76ms]
Runtime for poller module ‘processors’: 0.0253 seconds with 93096 bytes
SNMP: [1/0.02s] MySQL: [2/0.00s] RRD: [2/0.00s]
Unload poller module processors
RRD[update /opt/librenms/rrd/192.168.1.111/poller-perf-processors.rrd N:0.025280952453613]
Start Device Groups
SQL[SELECT * FROM device_groups ORDER BY name 0.18ms]
SQL[SELECT device_group_id FROM device_group_device WHERE device_id=? [1] 0.23ms]
Groups Added:
Groups Removed:
End Device Groups
RRD[update /opt/librenms/rrd/192.168.1.111/ping-perf.rrd N:1.52]
RRD[update /opt/librenms/rrd/192.168.1.111/poller-perf.rrd N:1.137]
SQL[UPDATE devices set uptime=?,last_ping=NOW(),last_ping_timetaken=? WHERE device_id = ? [4246711,“1.52”,1] 1.42ms]
Updating 192.168.1.111
Polled in 1.137 seconds
Start Alerts
SQL[select * from devices where devices.device_id = ? limit 1 [1] 0.83ms]
SQL[select device_groups.*, device_group_device.device_id as pivot_device_id, device_group_device.device_group_id as pivot_device_group_id from device_groups inner join device_group_device on device_groups.id = device_group_device.device_group_id where device_group_device.device_id = ? [1] 0.29ms]
SQL[select exists(select * from alert_schedule inner join alert_schedulables on alert_schedule.schedule_id = alert_schedulables.schedule_id where ((recurring = ? and start <= NOW() and end >= NOW()) or (recurring = ? and (start_recurring_dt <= date_format(NOW(), ‘–%d’) and (end_recurring_dt >= date_format(NOW(), ‘–%d’) or end_recurring_dt is null or end_recurring_dt = ? or end_recurring_dt = ?)) and start_recurring_hr <= date_format(NOW(), ‘%H:%i:%s’) and end_recurring_hr >= date_format(NOW(), ‘%H:%i:%s’) and (recurring_day like CONCAT(‘%’, date_format(NOW(), ‘’), ‘%’) or recurring_day is null or recurring_day = ?))) and ((alert_schedulable_type = ? and alert_schedulable_id = ?) or (alert_schedulable_type = ? and 0 = 1))) as exists [0,1,“0000-00-00”,“”,“”,“device”,1,“device_group”] 0.69ms]
SQL[SELECT DISTINCT a.* FROM alert_rules a
LEFT JOIN alert_device_map d ON a.id=d.rule_id
LEFT JOIN alert_group_map g ON a.id=g.rule_id
LEFT JOIN device_group_device dg ON g.group_id=dg.device_group_id
WHERE a.disabled = 0 AND ((d.device_id IS NULL AND g.group_id IS NULL) OR d.device_id=? OR dg.device_id=?) [1,1] 0.26ms]
End Alerts
SQL[INSERT IGNORE INTO perf_times (type,doing,start,duration,devices,poller) VALUES (:type,:doing,:start,:duration,:devices,:poller) {“type”:“poll”,“doing”:“1”,“start”:1553084556.194735,“duration”:“1.500”,“devices”:1,“poller”:“nms”} 10.19ms]
./poller.php 1 2019-03-20 14:22:37 - 1 devices polled in 1.500 secs
SNMP [4/0.08s]: Get[4/0.08s] Getnext[0/0.00s] Walk[0/0.00s]
MySQL [9/0.03s]: Cell[1/0.00s] Row[-1/-0.00s] Rows[4/0.01s] Column[1/0.00s] Update[2/0.00s] Insert[2/0.01s] Delete[0/0.00s]
RRD [6/0.00s]: Update[6/0.00s] Create [0/0.00s] Other[0/0.00s]
At time of capture, SNMP reply contained 1%. You can run exactly the same snmpget command various time to see how it evolves on this particular device.
#### Load poller module processors ####
SNMP[e[0;36m'/usr/bin/snmpget' '-v2c' '-c' 'ciscoo' '-OUQn' '-M' '/opt/librenms/mibs:/opt/librenms/mibs/cisco' 'udp:192.168.1.111:161' '.1.3.6.1.4.1.9.6.1.101.1.8.0'e[0m]
1%
RRD[e[0;32mupdate /opt/librenms/rrd/192.168.1.111/processor-ciscosb-0.rrd N:1e[0m]
RRDtool Output:
>> Runtime for poller module 'processors': 0.0266 seconds with 93096 bytes
>> SNMP: [1/0.02s] MySQL: [2/0.01s] RRD: [2/0.00s]
#### Unload poller module processors ####
here is all ouput
Does some possibility exist to receive more often polling maybe after that the graph will be correct ?
You can do 1 min polling: https://docs.librenms.org/Support/1-Minute-Polling/
CAUTION: Be sure your librenms server and devices can do 1min polling!!
Did not have a chance to see your files, please use https://p.libren.ms/ .
That being said, 1 min polling is heavy for both librenms server and the polled devices, so do a few tests before running that in production.
Again, the issue here seems to be the way Cisco provides the SNMP value, averaged over 1 minute, compared to the way Cisco draws the GUI value. There is no way to define which one is right and which one is wrong unless you ask them.
Here is output for previous command
https://p.libren.ms/view/901d2fa1
Also i attached screen for previous day cpu utilization that seems to be wrong, because the graph didn’t reach point more than 10 %
In the capture above, here is the processor data replied by the device is 2%:
#### Load poller module processors ####
SNMP[[0;36m'/usr/bin/snmpget' '-v3' '-l' 'authPriv' '-n' "" '-a' 'SHA' '-A' 'password' '-u' 'user1' '-x' 'DES' '-X' 'password' '-OUQn' '-M' '/opt/librenms/mibs:/opt/librenms/mibs/cisco' 'udp:192.168.1.111:161' '.1.3.6.1.4.1.9.6.1.101.1.8.0'[0m]
2%
RRD[[0;32mupdate /opt/librenms/rrd/192.168.1.111/processor-ciscosb-0.rrd N:2[0m]
RRDtool Output: OK u:0.01 s:0.00 r:1.72

>> Runtime for poller module 'processors': 0.0493 seconds with 93096 bytes
>> SNMP: [1/0.05s] MySQL: [2/0.00s] RRD: [2/0.00s]
#### Unload poller module processors ####
LibreNMS is using whatever value the switches supplies, if it doesn’t match the CLI, there is nothing we can do unfortunately…
So how do you think, increasing the polling time for 1 minute could resolve this problem ?
I am pretty sure it is not “as wrong” as you think it is. Just consider that the precision of the value is ± 10%. So you need to be informed it it goes to 80% (that is not good fir this kind of device to have 80% CPU). But from 0% to 40%, this is all right and you don’t have to worry about it.
ok, I got it
Also i want to ask about 2 problems that i have
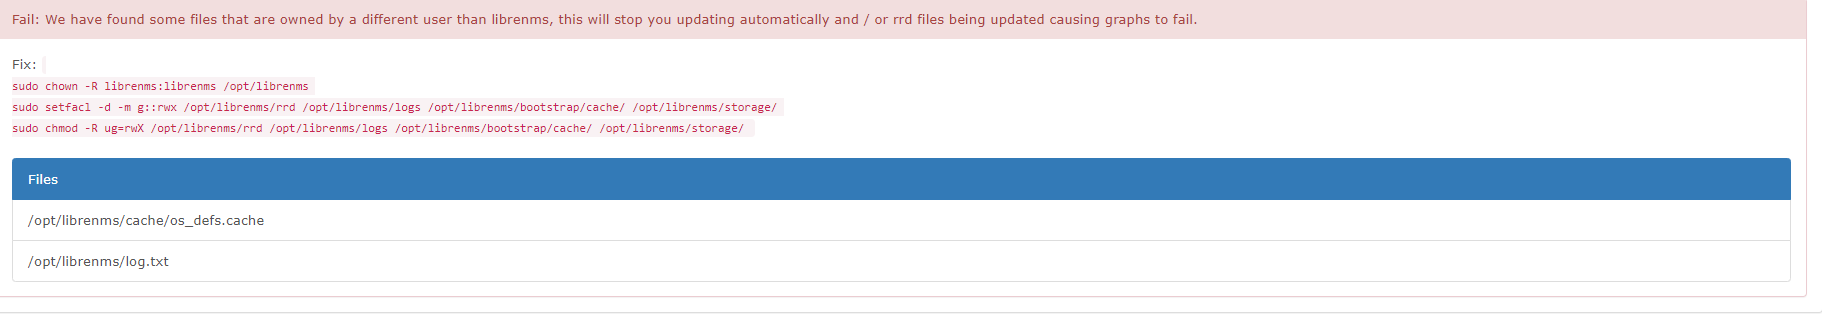
When i use script ./validate.php i always receive this, after executing commands to fix this problem returns on the next day
And the second problem is Syslog from Cisco
I try to do it as written on the site, all was fine, but logs not coming
The tcpdump shows that data is coming from device but not shown
Please open a new message for these 2, will be easier for others to help you  .
.
Bye