Summary
LibreNMS Poller
SQL[select migration from migrations order by id desc limit 1 0.23ms]
SQL[select count(*) as aggregate from migrations limit 1 0.19ms]
SQL[SELECT version() 0.14ms]
===================================
Version info:
Commit SHA: 411f36a9a1d6aaad47e8ae3ad3547715c58170ed
Commit Date: 1551670633
DB Schema: 2019_02_10_220000_add_dates_to_fdb (132)
PHP: 7.2.15-0ubuntu0.18.04.1
MySQL: 10.1.38-MariaDB-0ubuntu0.18.04.1
RRDTool: 1.7.0
SNMP: NET-SNMP 5.7.3
==================================DEBUG!
Updating os_def.cache…
Done
Override poller modules: processors
Starting polling run:
SQL[SELECT * FROM devices WHERE disabled = 0 AND device_id = 2 ORDER BY d evice_id ASC 2.44ms]
SQL[SELECT * FROM devices_attribs WHERE device_id = ? [2] 0.18ms]
Hostname: 192.168.1.22
Device ID: 2
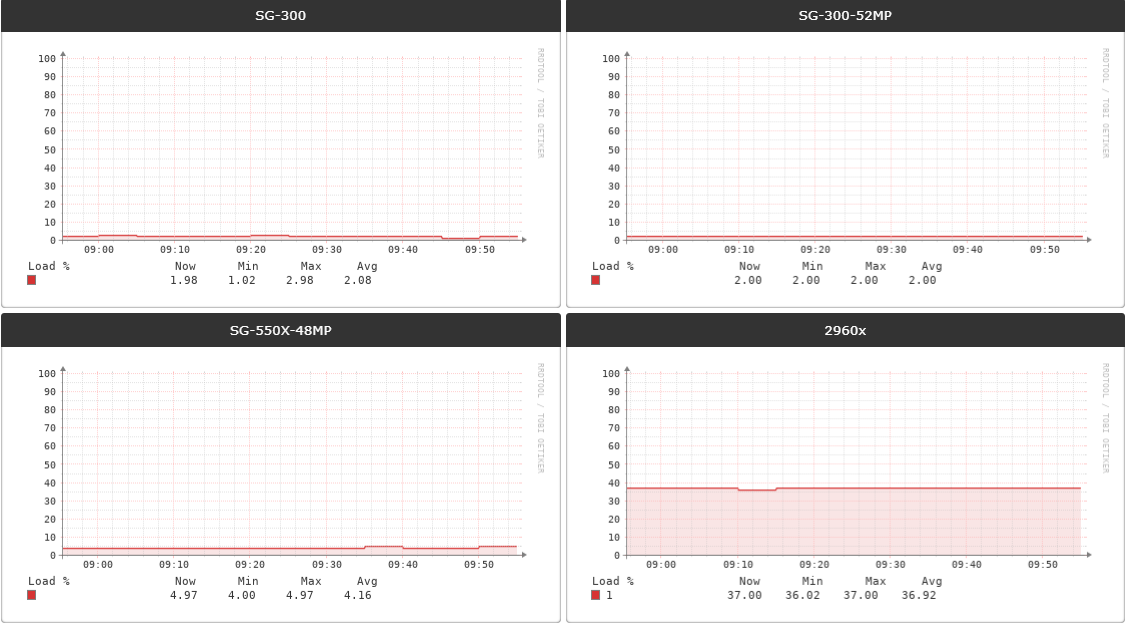
OS: ciscosb
Warning: inet_pton(): Unrecognized address in /opt/librenms/includes/polling/fu nctions.inc.php on line 249
[FPING] /usr/bin/fping -e -q -c 3 -p 500 -t 500 192.168.1.22
array (
‘xmt’ => ‘3’,
‘rcv’ => ‘3’,
‘loss’ => ‘0’,
‘min’ => ‘1.14’,
‘max’ => ‘1.35’,
‘avg’ => ‘1.25’,
‘exitcode’ => 0,
)
SQL[INSERT IGNORE INTO device_perf (xmt,rcv,loss,min,max,avg,devi ce_id,timestamp,debug) VALUES (:xmt,:rcv,:loss,:min,:max,:avg,:device_id,N OW(),:debug) {“xmt”:“3”,“rcv”:“3”,“loss”:“0”,“min”:“1.14”,“max”:“1.35”,“avg”:“1. 25”,“device_id”:2,“debug”:“”} 203.46ms]
SNMP Check response code: 0
Modules status: Global+
OS
Device
Load poller module core
SNMP[‘/usr/bin/snmpget’ ‘-v2c’ ‘-c’ ‘COMMUNITY’ ‘-OQnUt’ ‘-m’ ‘SNMPv2-MIB’ ‘-M’ ‘/opt/librenms/mibs:/opt/librenms/mibs/cisco’ ‘udp:HOSTNAME:161’ ‘sysUpTime.0’ ’ sysLocation.0’ ‘sysContact.0’ ‘sysName.0’ ‘sysObjectID.0’ ‘sysDescr.0’]
...0 = 105864600
...0 = local-dc
...0 = ao
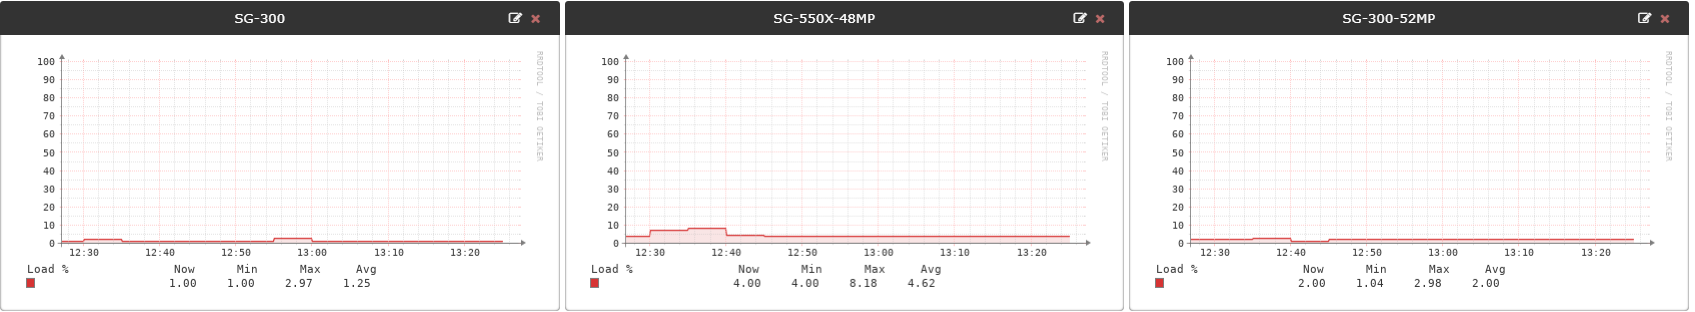
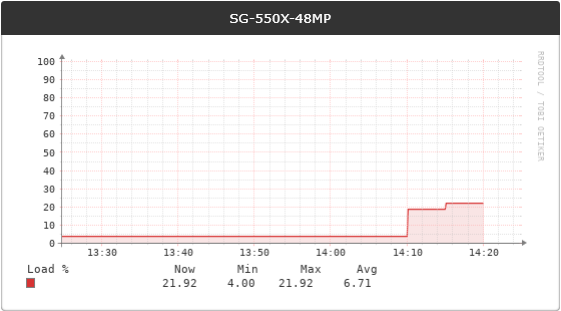
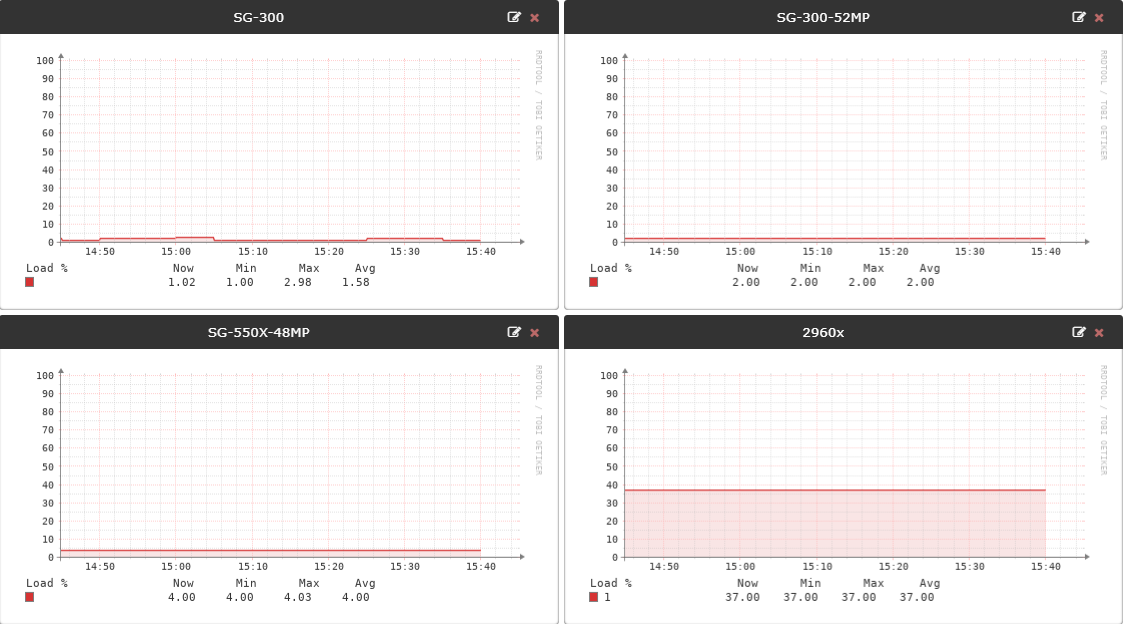
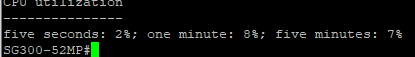
...0 = SG550X-48MP
...0 = ...*
...0 = SG550X-48MP 48-Port Gigabit PoE Stackable Managed Switch
SNMP[‘/usr/bin/snmpget’ ‘-v2c’ ‘-c’ ‘COMMUNITY’ ‘-OQnUst’ ‘-m’ ‘HOST-RESOURCES-M IB:SNMP-FRAMEWORK-MIB’ ‘-M’ ‘/opt/librenms/mibs:/opt/librenms/mibs/cisco’ ‘udp:H OSTNAME:161’ ‘snmpEngineTime.0’ ‘hrSystemUptime.0’]
snmpEngineTime.0 = 1058554
hrSystemUptime.0 = No Such Object available on this agent at this OID
Uptime seconds: 1058646
RRD[update /opt/librenms/rrd/192.168.1.22/uptime.rrd N:1058646]
Uptime: 12 days, 6h 4m 6s
SQL[select * from locations where (location = ?) limit 1 [“local-dc”] 0.26ms ]
Runtime for poller module ‘core’: 0.0399 seconds with 163216 bytes
SNMP: [2/0.04s] MySQL: [0/0.00s] RRD: [1/0.00s]
Unload poller module core
RRD[update /opt/librenms/rrd/192.168.1.22/poller-perf-core.rrd N:0.039893865585327 ]
Modules status: Global+
OS
Device
Load poller module processors
Attempting to initialize OS: ciscosb
OS initialized as Generic
SQL[SELECT * FROM processors WHERE device_id=? [2] 0.24ms]
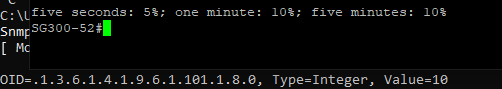
SNMP[‘/usr/bin/snmpget’ ‘-v2c’ ‘-c’ ‘COMMUNITY’ ‘-OUQn’ ‘-M’ ‘/opt/librenms/mibs :/opt/librenms/mibs/cisco’ ‘udp:HOSTNAME:161’ ‘.1.3.6.1.4.1.9.6.1.101.1.8.0’]
...*.0 = 5
array (
‘.1.3.6.1.4.1.9.6.1.101.1.8.0’ => ‘5’,
)
5%
RRD[update /opt/librenms/rrd/192.168.1.22/processor-ciscosb-0.rrd N:5]
SQL[UPDATE processors set processor_usage=? WHERE processor_id = ? [5,2] 2 .37ms]
Runtime for poller module ‘processors’: 0.0227 seconds with 92720 bytes
SNMP: [1/0.01s] MySQL: [2/0.00s] RRD: [2/0.00s]
Unload poller module processors
RRD[update /opt/librenms/rrd/192.168.1.22/poller-perf-processors.rrd N:0.022674083 709717]
Start Device Groups
SQL[SELECT * FROM device_groups ORDER BY name 0.36ms]
SQL[SELECT device_group_id FROM device_group_device WHERE device_id=? [2] 0.24ms]
Groups Added:
Groups Removed:
End Device Groups
RRD[update /opt/librenms/rrd/192.168.1.22/ping-perf.rrd N:1.25]
RRD[update /opt/librenms/rrd/192.168.1.22/poller-perf.rrd N:1.319]
SQL[UPDATE devices set uptime=?,last_ping=NOW(),last_ping_timetaken=? WH ERE device_id = ? [1058646,“1.25”,2] 1.27ms]
Updating 192.168.1.22
Polled in 1.319 seconds
Start Alerts
SQL[select * from devices where devices.device_id = ? limit 1 [2] 0.68ms]
SQL[select device_groups.*, device_group_device.device_id as pivot_device _id, device_group_device.device_group_id as pivot_device_group_id from d evice_groups inner join device_group_device on device_groups.id = device _group_device.device_group_id where device_group_device.device_id = ? [2] 0.21ms]
SQL[select exists(select * from alert_schedule inner join alert_schedulables on alert_schedule.schedule_id = alert_schedulables.schedule_id where (( recurring = ? and start <= NOW() and end >= NOW()) or (recurring = ? and (start_recurring_dt <= date_format(NOW(), ‘–%d’) and (end_recurring_dt >= date_format(NOW(), ‘–%d’) or end_recurring_dt is null or end_recurring_dt = ? or end_recurring_dt = ?)) and start_recurring_hr <= date_format(NOW(), ‘% H:%i:%s’) and end_recurring_hr >= date_format(NOW(), ‘%H:%i:%s’) and (recurri ng_day like CONCAT(‘%’, date_format(NOW(), ‘’), ‘%’) or recurring_day is null or recurring_day = ?))) and ((alert_schedulable_type = ? and alert_schedul able_id = ?) or (alert_schedulable_type = ? and 0 = 1))) as exists [0,1,“00 00-00-00”,“”,“”,“device”,2,“device_group”] 0.58ms]
SQL[SELECT DISTINCT a.* FROM alert_rules a
LEFT JOIN alert_device_map d ON a.id=d.rule_id
LEFT JOIN alert_group_map g ON a.id=g.rule_id
LEFT JOIN device_group_device dg ON g.group_id=dg.device_group_id
WHERE a.disabled = 0 AND ((d.device_id IS NULL AND g.group_id IS NULL) OR d.de vice_id=? OR dg.device_id=?) [2,2] 0.25ms]
End Alerts
SQL[INSERT IGNORE INTO perf_times (type,doing,start,duration,devices ,poller) VALUES (:type,:doing,:start,:duration,:devices,:poller) {“type”:“pol l”,“doing”:“2”,“start”:1551794738.691919,“duration”:“1.634”,“devices”:1,“poller” :“nms”} 1.73ms]
./poller.php 2 2019-03-05 16:05:40 - 1 devices polled in 1.634 secs
SNMP [4/0.06s]: Get[4/0.06s] Getnext[0/0.00s] Walk[0/0.00s]
MySQL [9/0.22s]: Cell[1/0.00s] Row[-1/-0.00s] Rows[4/0.01s] Column[1/0.00s] Upda te[2/0.00s] Insert[2/0.21s] Delete[0/0.00s]
RRD [6/0.00s]: Update[6/0.00s] Create [0/0.00s] Other[0/0.00s]