Q1.
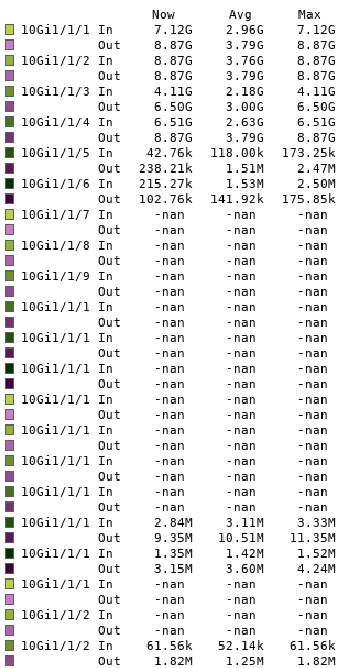
Interface names are truncated in “Total Traffic” graphs and some ports are not recognisable :
E.g.:
10Gi1/1/1
10Gi1/1/2
.
.
.
10Gi1/1/9
10Gi1/1/1?
10Gi1/1/1?
10Gi1/1/1?
I know it is 10,11,12 but just can’t see it.
Anyone could help me to solve?
@Kevin_Krumm Got it. @Hung is asking if there is a way to see the interface name “complete” instead of truncated as the captures shows.
I don’t use the legend on this graph most of the time. But I found a Huawei device to reproduce this issue in my equipments.
Only option here, change the length at which the trucate is done.
For Q2, that is not possible today. Any contribution is welcomed to add this.
As far as you look…
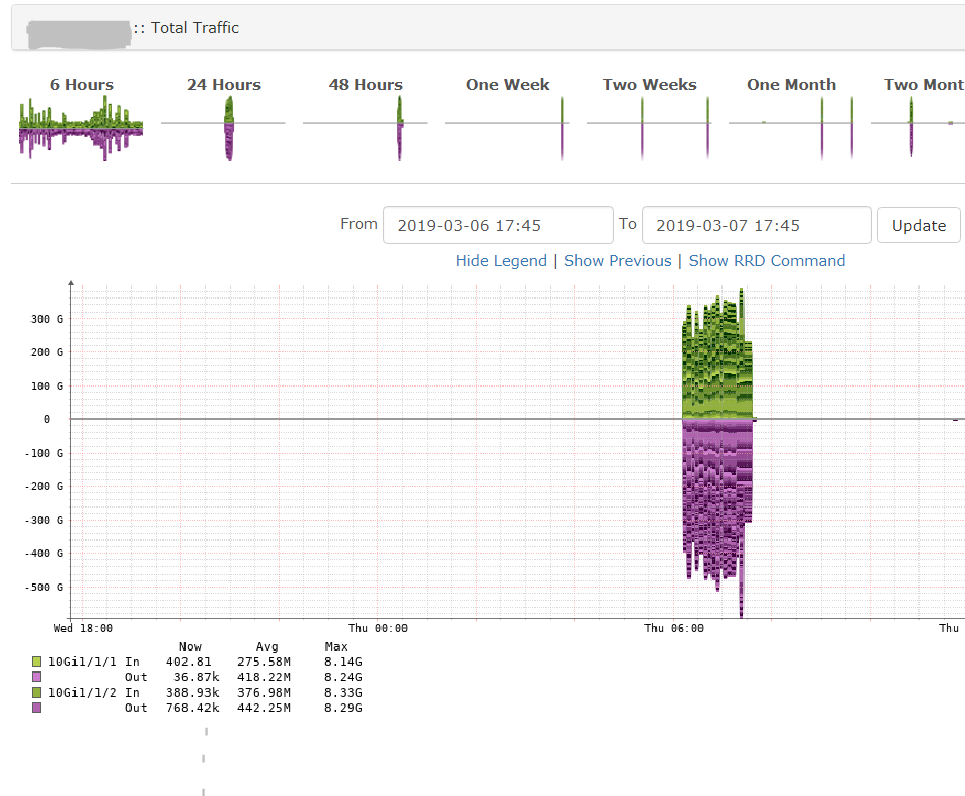
When 3/6 06:00 ~ 08:00
The traffic very high…but could not sout it.
And it’s also let Switch down…
These questions have always puzzled me. I’m extremely keen on finding out.
biweekly happend…
Somebody need to write a patch to get the interface names visible for Q1.
For Q2, sorting is possible, but only using the last measurement like @Chas suggested. The SQL database only store the last values so there is no way to sort the average as you seem to want.