Hi All,
I’m trying to create a Custom Graph with data outputted from multiple temperature sensors on a Raspberry Pi.
I have created a python script which outputs the following when doing an snmpwalk:
snmpwalk -c community -v2c rpi-temp01 -Oqv .1.3.6.1.4.1.8072.1.3.2.4.1.2.15.99.97.98.105.110.101.116.95.99.108.105.109.97.116.101
“33”
“32”
“31”
“30”
There are 4 sensors total. Of which 2 are Temperature and 2 are Humidity.
From there I have created the Application in:
/includes/polling/applications/cabinet_climate.inc.php
Then the page in:
/includes/html/pages/device/apps/cabinet_climate.inc.php
And Finally the Graphs in: /opt/librenms/includes/html/graphs/application/cabinet_climate_temperature.inc.php
and
/opt/librenms/includes/html/graphs/application/cabinet_climate_humidity.inc.php
The ./poller.php and ./validate.php output are also in the paste link.
Now when I enable the Application in the Web UI, it shows the Graphs OK, but with NAN as the data.
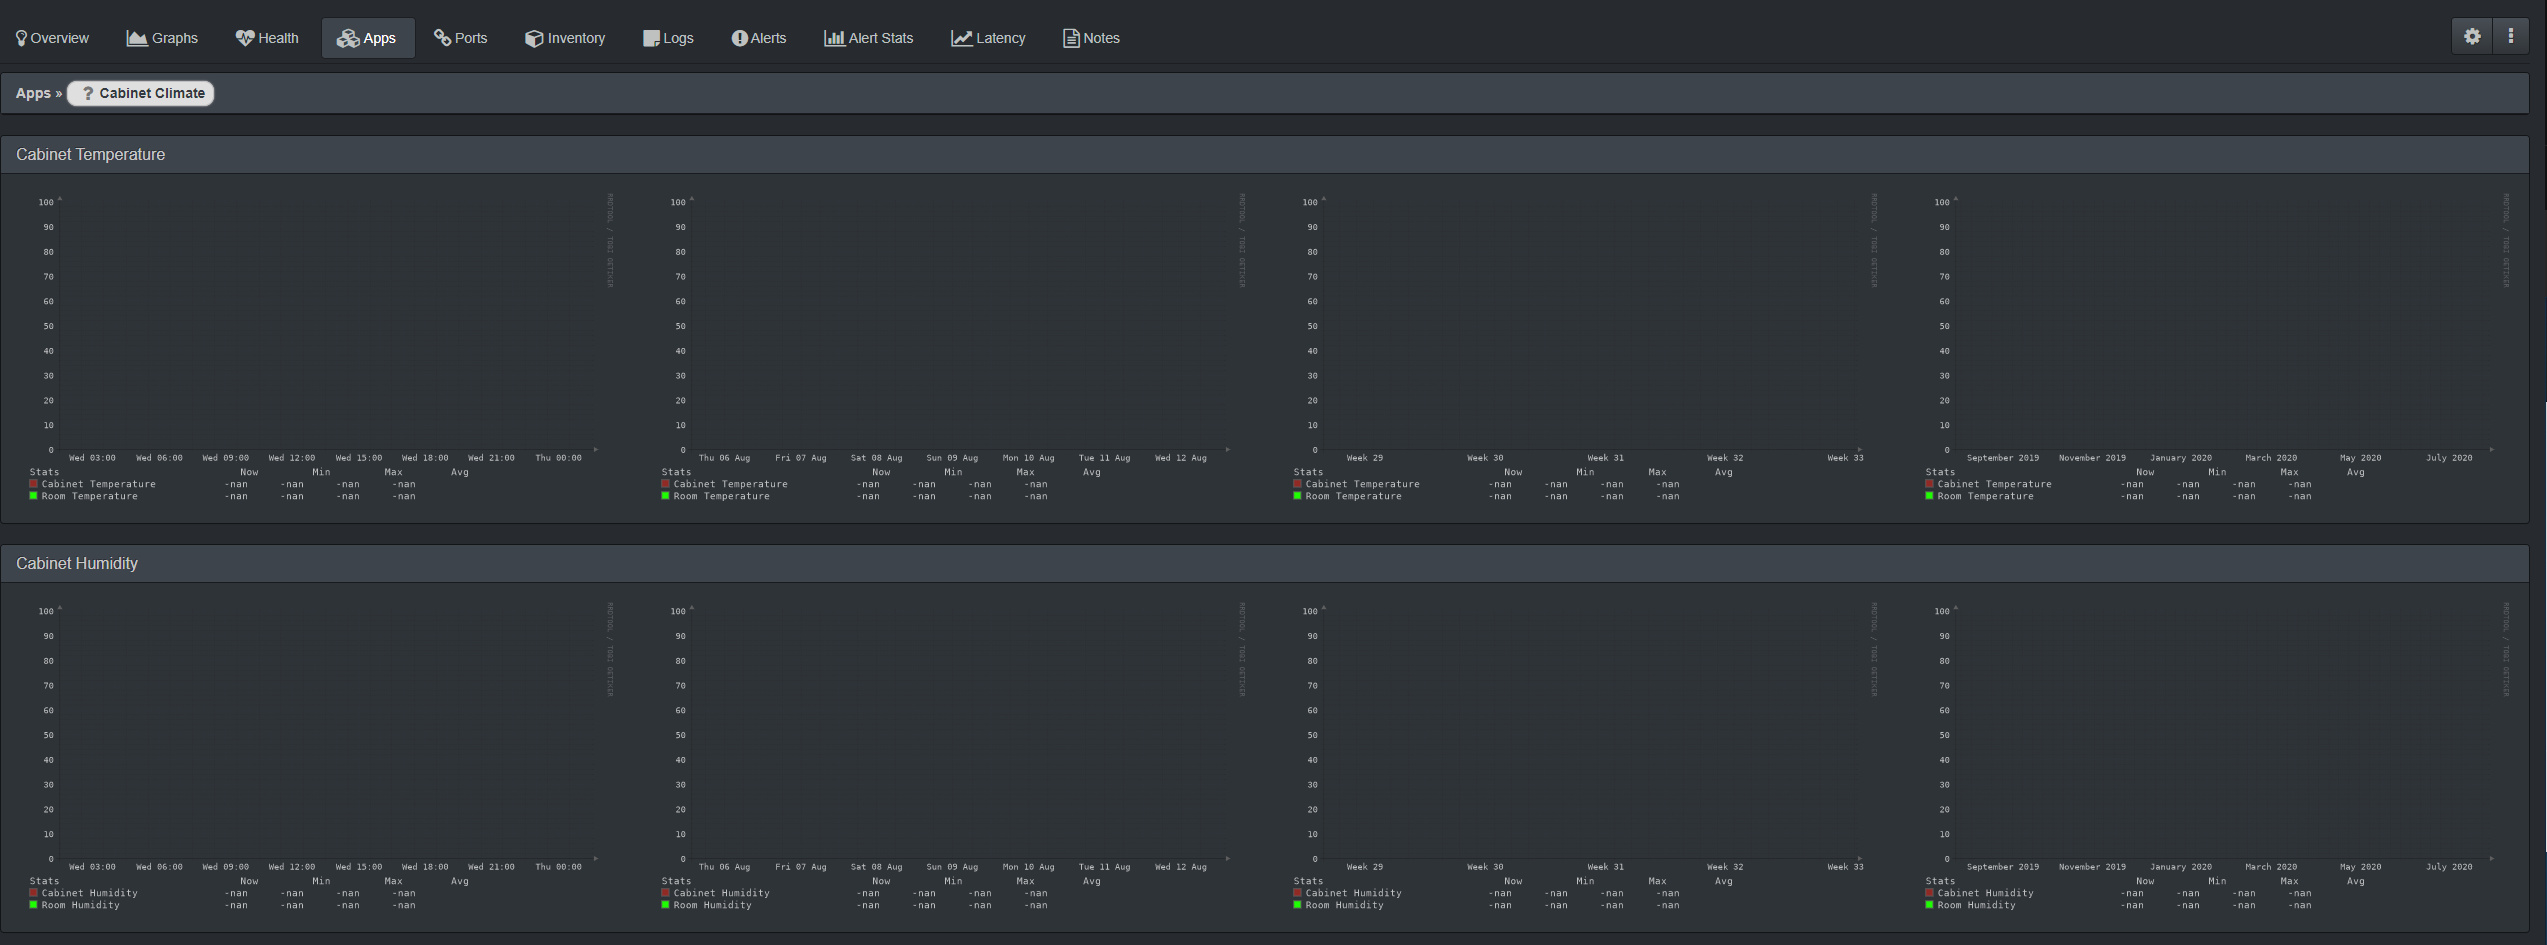
Would anybody be able to have a look at the code to see if you can see where I am going wrong? Apologies for the link-ception but I could only post 2 links!
https://p.libren.ms/view/f9b279ff
I referenced the pi-hole application for most of the code.
Appreciate the help in advance!
Dan