Are you using the Dispatcher Service? I am seeing similar behavior since switching from the Cron jobs to the service. I am in GMT-0400, and have gaps every evening from 20:00 - 20:20.
Anyone else running the service care to comment on whether you’ve seen this behavior?
Yes I am using this service.
I ended up moving back to the cron jobs.
I have similar issue since switching to the dispatcher service.
No other cron jobs run at this time. seems to be related to daily.sh:
[ Fri, 22 Nov 2019 00:03:14 +0000 ] LibreNMS Notifications (44)
[ Fri, 22 Nov 2019 00:03:14 +0000 ] misc/notifications.rss (55)
[ Fri, 22 Nov 2019 00:03:14 +0000 ] Updating DB Done
1 Like
I actually think this is correct. Looking at my information from the application it showed 24 million lines in my event log and the daily.sh was locking when running.I manually dealt with the 24 million lines so I will see if the gaps disappear tonight. Despite the 3 polling machines, off board SQL the processors on all items are running terribly high and I do wish Juniper would sort their SNMP engine out so it polled suitably in the polling time.
the things are getting worse for me, today poller stopped for 12 minutes:
/opt/librenms/poller.php 137 2020-01-03 00:07:33 - 1 devices polled in 77.23 secs
/opt/librenms/poller.php 483 2020-01-03 00:07:34 - 1 devices polled in 70.50 secs
/opt/librenms/discovery.php 70 2020-01-03 00:08:05 - 1 devices discovered in 137.4 secs
/opt/librenms/discovery.php 77 2020-01-03 00:08:24 - 1 devices discovered in 131.0 secs
/opt/librenms/discovery.php 76 2020-01-03 00:08:24 - 1 devices discovered in 132.6 secs
/opt/librenms/discovery.php 71 2020-01-03 00:08:54 - 1 devices discovered in 186.1 secs
/opt/librenms/discovery.php 72 2020-01-03 00:08:59 - 1 devices discovered in 187.0 secs
/opt/librenms/discovery.php 65 2020-01-03 00:18:20 - 1 devices discovered in 787.8 secs
/opt/librenms/poller.php 633 2020-01-03 00:19:00 - 1 devices polled in 36.61 secs
/opt/librenms/poller.php 206 2020-01-03 00:19:00 - 1 devices polled in 37.28 secs
/opt/librenms/poller.php 61 2020-01-03 00:19:00 - 1 devices polled in 37.54 secs
In daily.logs I see it was dealing with around 1M rows, so what I’ve tried is to purge a bit more, I set syslog messages to be cleaned each day and re-run ./daily.sh:
Syslog cleared for entries over 1 days (about 6158000 rows)
And no gaps.
Seems something else but not purging unused data locks the poller.
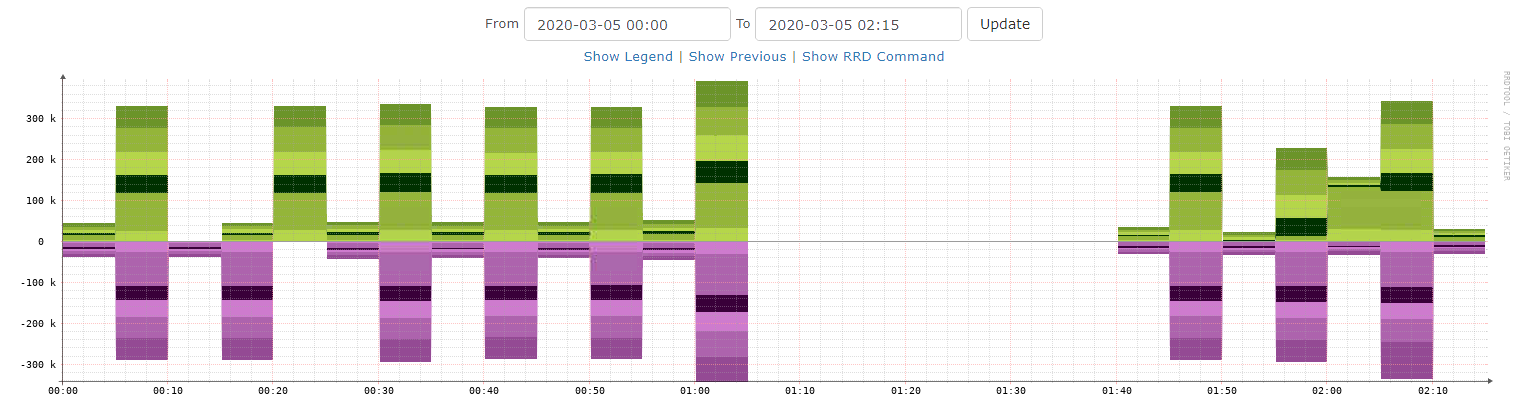
Hi, could you please let me know if you managed to fix this issue permanently? I am facing that exact same problem, currently with a 26-minute gap:
/opt/librenms/discovery.php 267 2020-03-05 01:08:03 - 1 devices discovered in 48.29 secs
/opt/librenms/discovery.php 268 2020-03-05 01:08:06 - 1 devices discovered in 48.32 secs
/opt/librenms/discovery.php 257 2020-03-05 01:08:10 - 1 devices discovered in 81.83 secs
/opt/librenms/discovery.php 64 2020-03-05 01:34:11 - 1 devices discovered in 1994. secs
/opt/librenms/discovery.php 193 2020-03-05 01:36:01 - 1 devices discovered in 1915. secs
/opt/librenms/poller.php 38 2020-03-05 01:36:11 - 1 devices polled in 9.689 secs
Daily.log:
Updating to latest codebase
fatal: unable to access 'https://github.com/librenms/librenms.git/': Operation timed out after 300018 milliseconds with 0 out of 0 bytes received
Returned: 1
Updating Composer packages


  [Composer\Downloader\TransportException]
  The "https://getcomposer.org/versions" file could not be downloaded: SSL: Handshake timed out
  Failed to enable crypto
  failed to open stream: operation failed


self-update [-r|--rollback] [--clean-backups] [--no-progress] [--update-keys] [--stable] [--preview] [--snapshot] [--set-channel-only] [--] [<version>]

> LibreNMS\ComposerHelper::preInstall
Loading composer repositories with package information
Installing dependencies from lock file
Nothing to install or update
Generating optimized autoload files
> Illuminate\Foundation\ComposerScripts::postAutoloadDump
> @php artisan package:discover --ansi
Discovered Package: ^[[32mdarkghosthunter/larapoke^[[39m
Discovered Package: ^[[32mfideloper/proxy^[[39m
Discovered Package: ^[[32mlaravel/laravel^[[39m
Discovered Package: ^[[32mlaravel/tinker^[[39m
Discovered Package: ^[[32mmartinlindhe/laravel-vue-i18n-generator^[[39m
Discovered Package: ^[[32mnesbot/carbon^[[39m
Discovered Package: ^[[32moriceon/toastr-5-laravel^[[39m
Discovered Package: ^[[32mspatie/laravel-cors^[[39m
Discovered Package: ^[[32mtightenco/ziggy^[[39m
^[[32mPackage manifest generated successfully.^[[39m
> LibreNMS\ComposerHelper::postInstall
> Illuminate\Foundation\ComposerScripts::postInstall
> @php artisan vue-i18n:generate --multi-locales --format=umd
Returned: 0
Updating SQL-Schema
^[[32mNothing to migrate.^[[39m
Returned: 0
Updating submodules

Returned: 0
Cleaning up DB
Refreshing alert rules queries
Clearing OS cache
Refreshing device group table relationships
Syslog cleared for entries over 30 days (about 0 rows)
Authlog cleared for entries over 30 days
Perf times cleared for entries over 30 days
Device perf cleared for entries over 7 days
Deleting alert_logs more than 365 days that are not active
Deleting history of active alert_logs more than 365 days
All deleted ports now purged
Returned: 0
Fetching notifications
[ Thu, 05 Mar 2020 01:06:24 +0100 ] http://www.librenms.org/notifications.rss (1)
[ Thu, 05 Mar 2020 01:07:24 +0100 ] misc/notifications.rss (13)
[ Thu, 05 Mar 2020 01:07:24 +0100 ] Updating DB  Done
Returned: 0
Caching PeeringDB data
Peering DB integration disabled
Returned: 0
Thanks!
Could this issue be related to this error while accessing github? It is a proxy variable issue, as daily.sh works nicely when I run it manually:
librenms@no1-librenms-1:~/logs$ …/./daily.sh
Updating to latest codebase OK
Updating Composer packages OK
Updated from baee55a to 2c91724 OK
Updating SQL-Schema OK
Updating submodules OK
Cleaning up DB OK
Fetching notifications OK
Caching PeeringDB data OK
I have set the Environment variables in the service definition file now, defining the proxy URL. Tomorrow, when daily upgrade runs again, I will validate the change.
Updated:
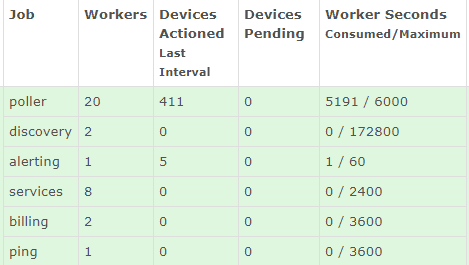
The problem didn’t happen last night with the discover running with only 2 workers.
Do you have any progress on this?
I am still having gaps, not every day, but maybe 2-3 times a week.
I am still facing the issue. Today I increased the snmpbulkwalk repeaters to speed up the polls, let’s see what happens - overall poller time was reduced by 20%. The problem is that these gaps appear usually in the early hours, so I have to wait until tomorrow.
In the meantime, I have requested the server team to upscale the VM. Today I have an all-in-one 16-CPU box, monitoring 410 devices and over 20k ports, so it is very likely that a performance issue is also present.
I have around 1K devices, slowly moving to the distributed setup.
How many (v)CPUs do you have in place?
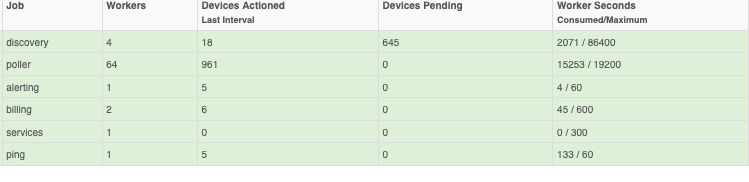
This is how poller config looks to me at the moment:
Hello,
Confirming this issue for dispatcher service without distributed poller setup.
No gaps with crontab, daily ~30min gap with systemd service, while service just stop polling wihout any errors in log.
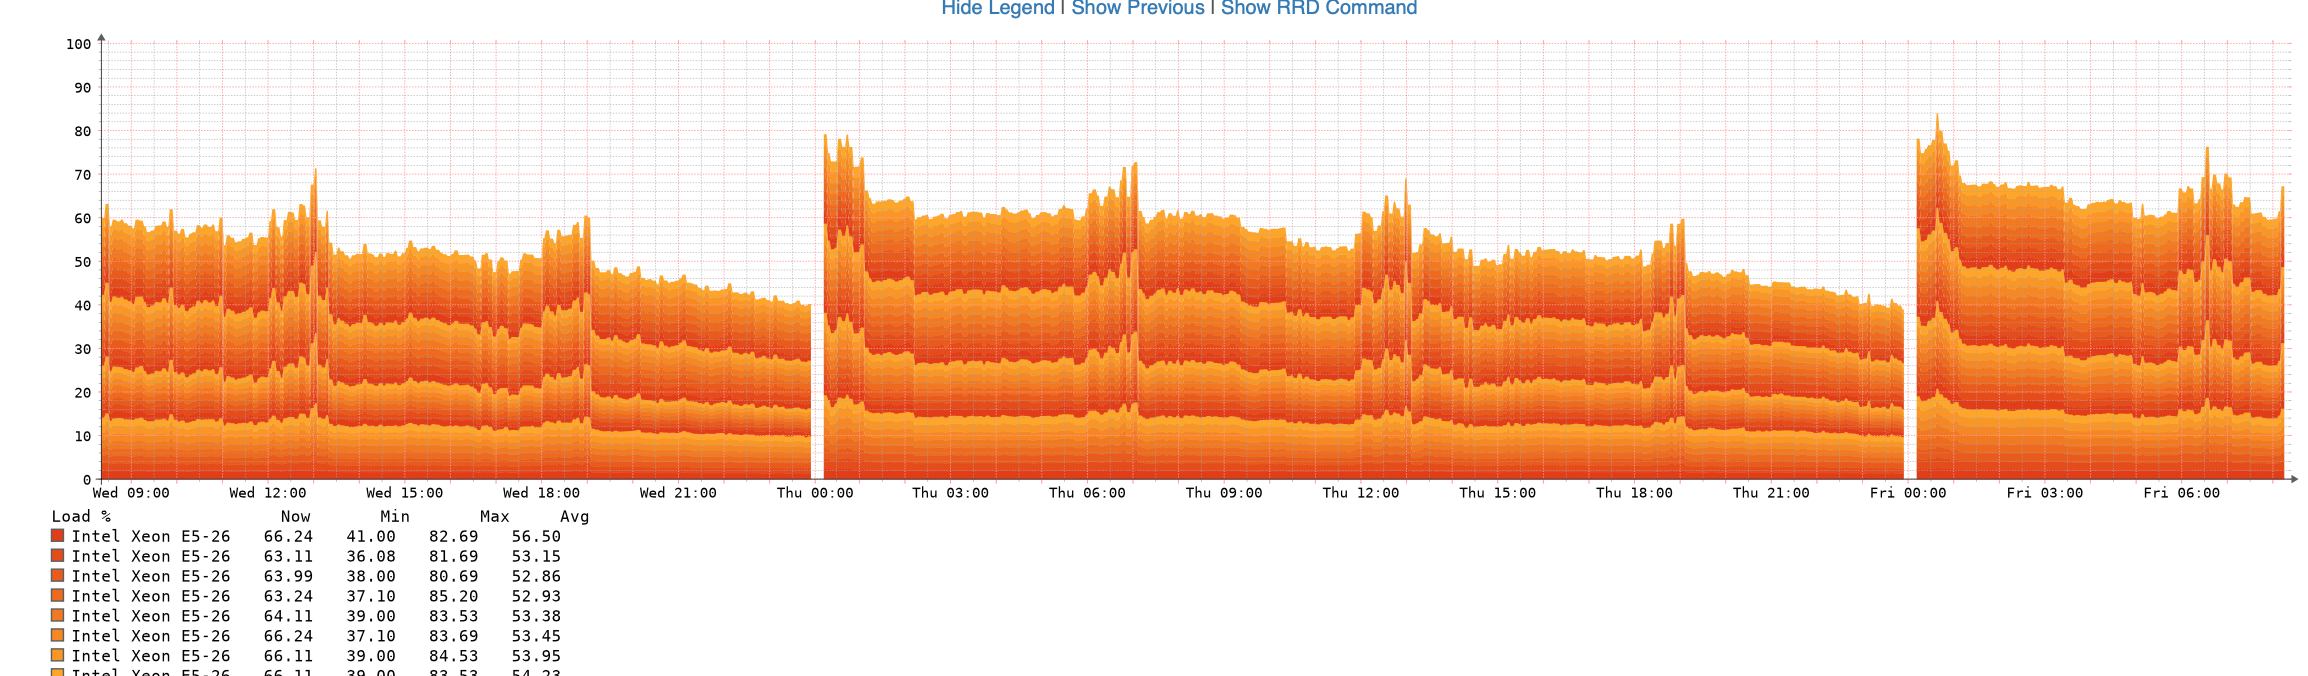
it is Intel® Xeon® CPU E5-2670.
I also found out that librenms waits all processes to complete, and it causes the gaps:
Mar 18 00:04:31 librenms librenms-service.py[50328]: maintenance(INFO):Restarting service...
...
Mar 18 00:10:51 librenms librenms-service.py[50328]: Discovery_0-4(INFO):Completed discovery run for 18 in 583.28s
Mar 18 00:10:51 librenms librenms-service.py[50328]: MainThread(INFO):Configuring LibreNMS service
I don’t know if it is expected behavior.
I think its related to the daily maintenance, mainly due to cleanup
might be, but as you can see in the logs above there is a strict correlation between completion of the last discovery process and starting librenms-service
My first idea also that its some cleanup of ports, fdb or something, but strange that it only effect on dispatcher service polling and invisible for old crontab polling.
I also faced this issue and there have daily gap from 08:00 am to 08:40 am.
I’ve checked disk i/o and CPU utilization, and there have some strange status.
-
Utilization of RRDCached service getting lower in this period, and the process counter reduce from 50 times per minute to 10 times per minute.
-
Utilization of MYSQL also getting lower in this period, and the process counter reduce from 90 times per minute to 10-20 times per minute.
-
Disk write speed reduce from 30MB/s to 5MB/s in this period.
-
CPU idle percentage increase from 30% to 98% in this period.
I only monitor around 200 devices on it, and I use VM instead of appliance server.
Is there have any way to find out root cause on this issue?
Are you backing up the VM at that hour by casuality?