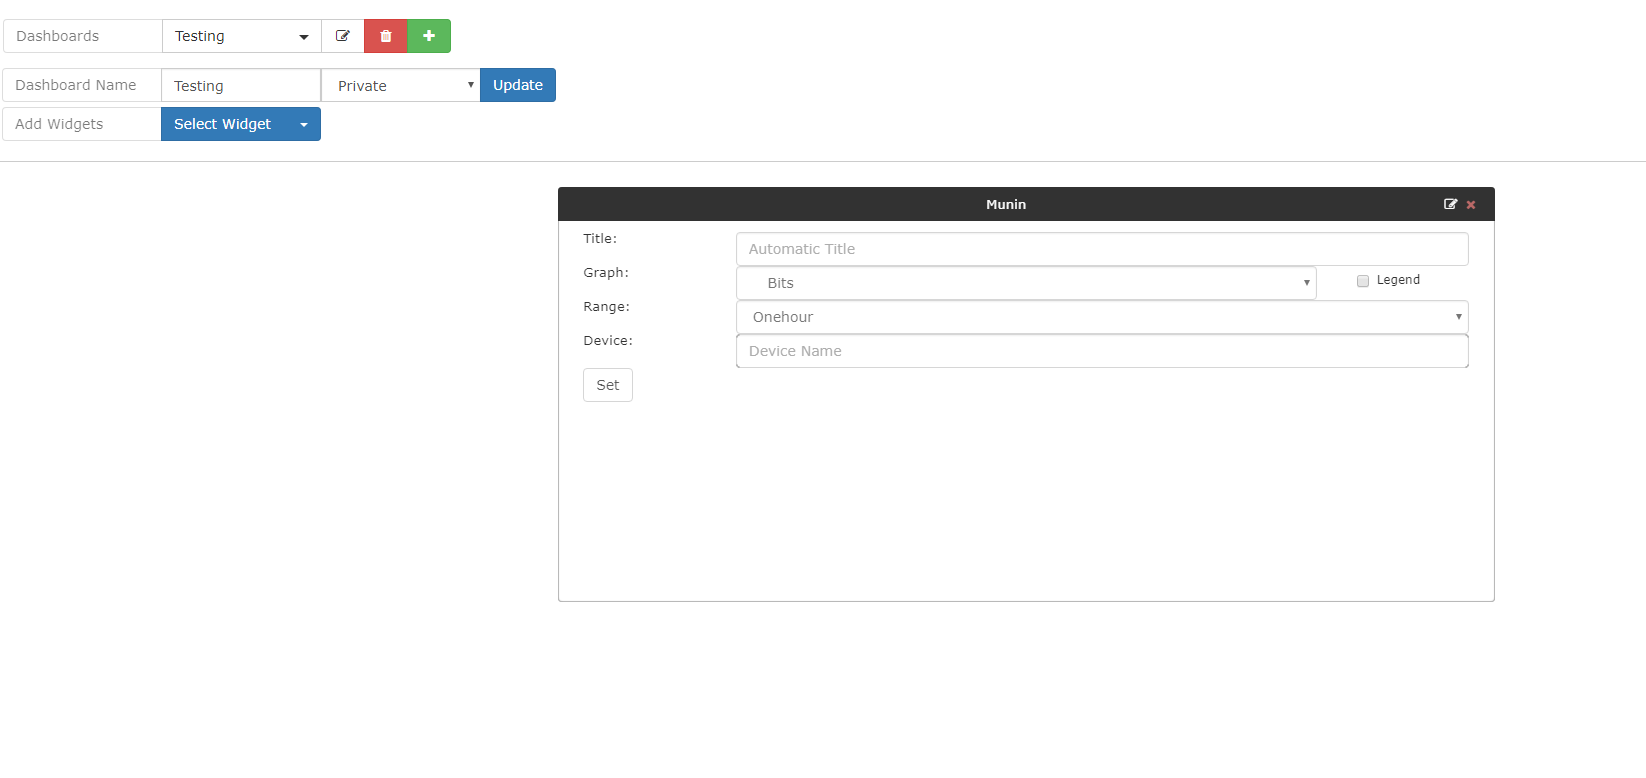
I’m trying to set Graph on the dashboard for specific device and specific port, by when I choose the device, it gives me the overall traffic , here is the string what it adds:
{“device_id”:“2”,“device_image”:“images/os/arista.svg”,“name”:"dl1its02.pan.local (dl1its02) ",“device_os”:“Arista EOS”,“version”:“4.14.2F”,“device_hardware”:“DCS-7050SX-64”,“device_ports”:“83”,“location”:“DL1”}
How can I pull the graph to the dashboard for specific port?
Yes it is possible, Graph Widget> Device Bits
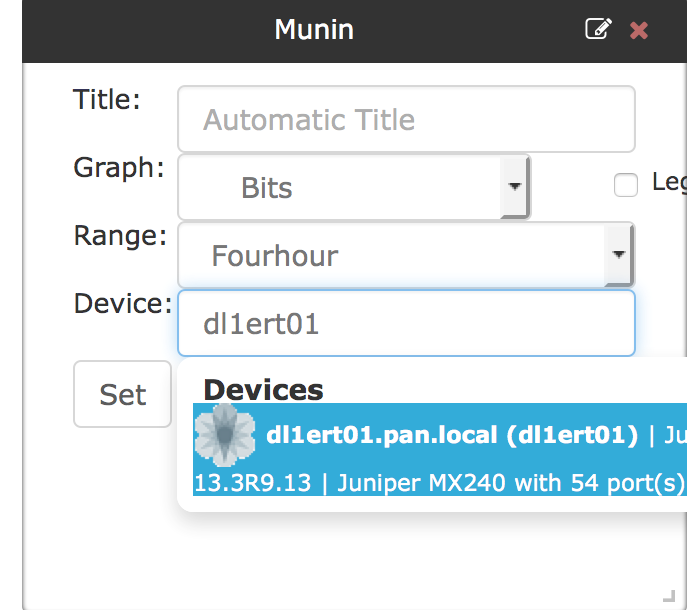
Then you need to type in the name of the device or Port you want to graph.
Hi Kevin,
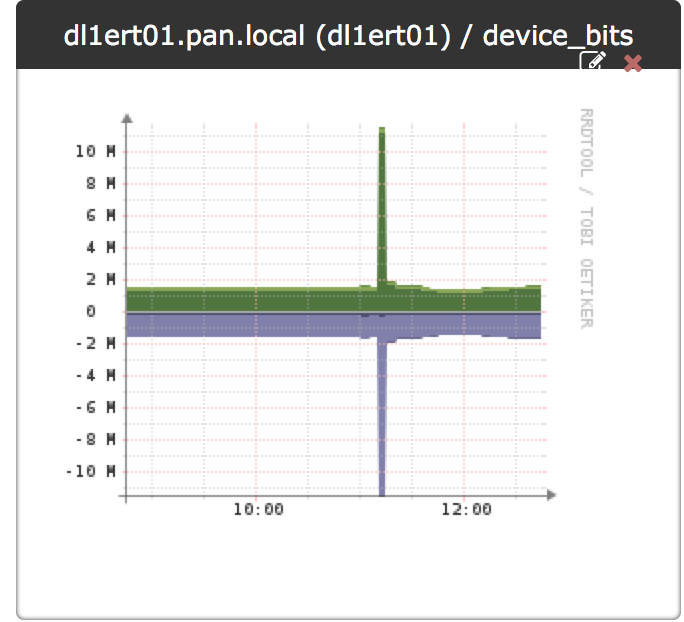
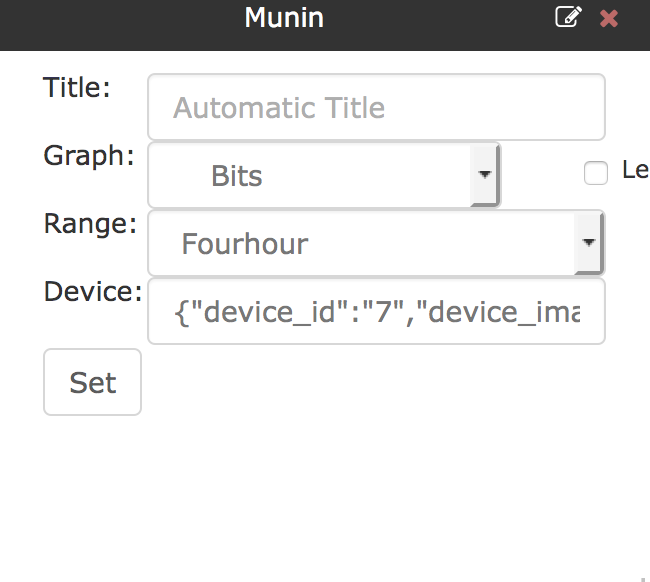
I tried to set the following entry, it’s still shows overall traffic for all ports
{“device_id”:“7”,“device_image”:“images/os/junos.png”,“name”:"dl1ert01.pan.local (dl1ert01) ",“device_os”:“Juniper JunOS”,“version”:“13.3R9.13”,“device_hardware”:“Juniper MX240”,“device_port”:“xe-1/0/0”,“location”:“DL1”}
can you post a screen shot?
In the Device: are you typing in the name of the device and then selecting what port you want to graph.
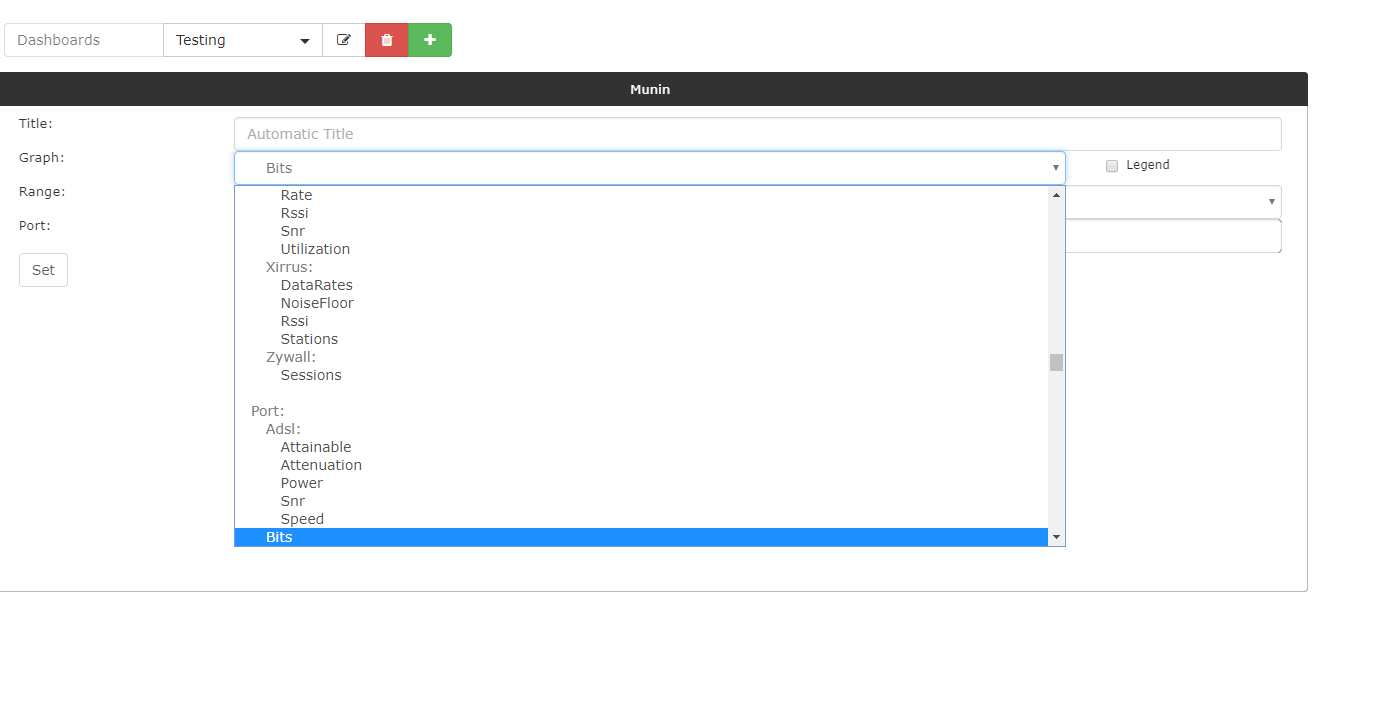
It shows me this , I can’t choose specific port