We have TVs that display the LibreNMS dashboard in our office
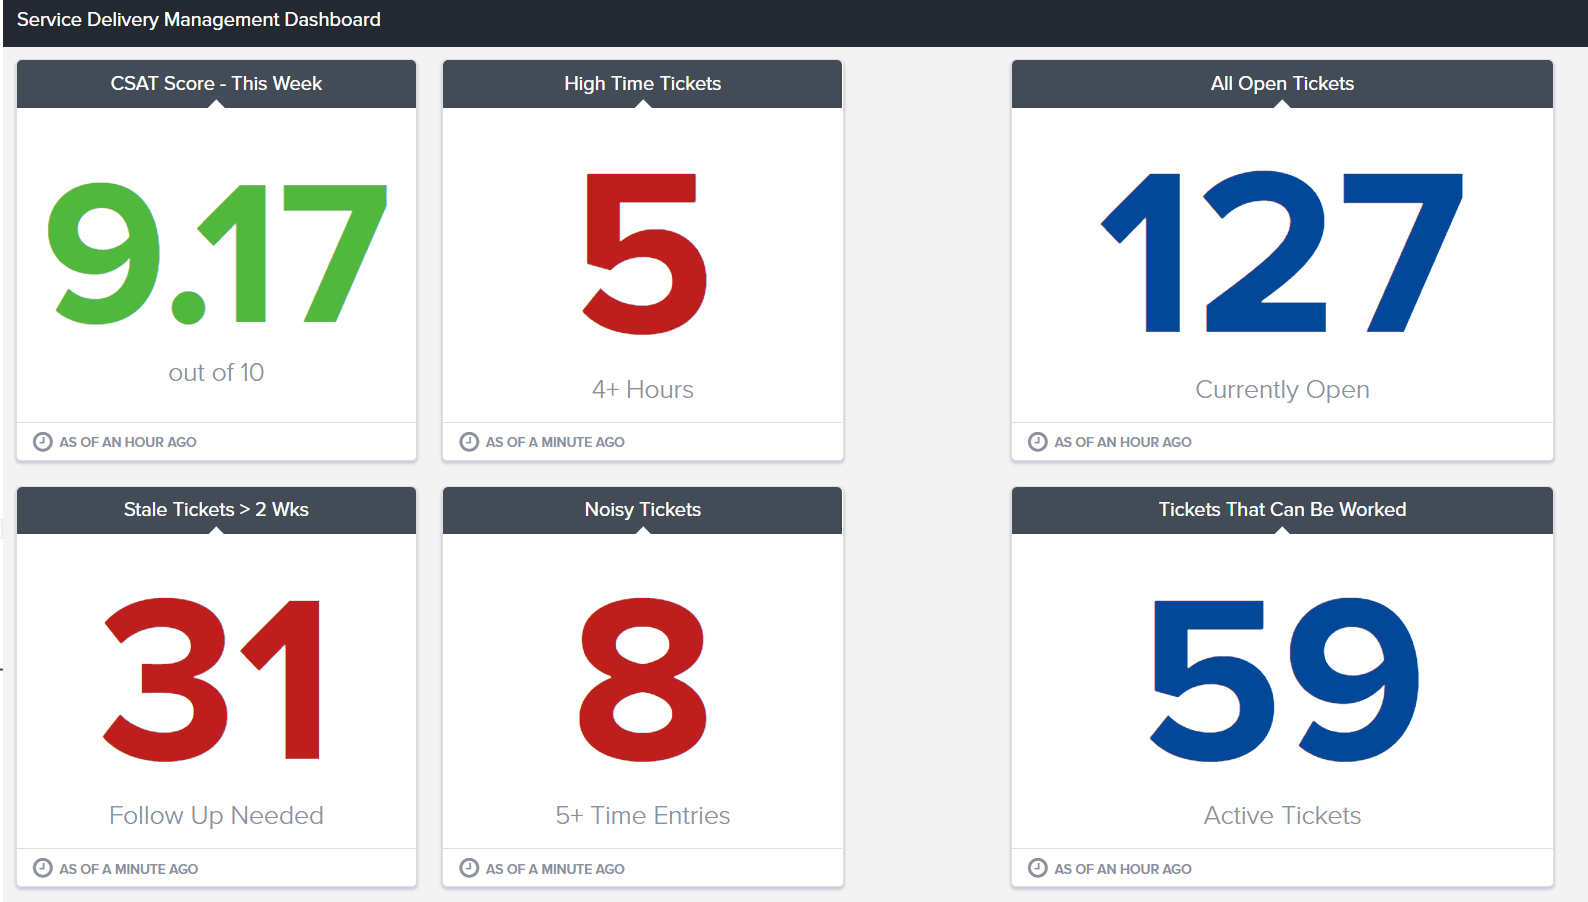
I would like to display info from our ticketing system (current number of tickets, etc)
We’re using a Nagios plugin to collect the current number of open tickets as a number
My issue is that I haven’t been able to find any method to create a dashboard widget that lets me just show the latest result
The issue isn’t specific to Nagios plugins. We’d also like to display the most recent value of a temperature sensor, rather than display a graph
My suspicion is that it’s not currently possible to do this in LibreNMS. Please correct me if I’m wrong
Would doing this require adding new dashboard widgets? I had a look in the /opt/librenms/resources/views/widgets directory, but I don’t know how to write PHP. Is there an obvious technical limitation preventing this type of widget from being created? I’m debating whether to try implementing a new widget to get this functionality
Bumping for keepalive. I’ve roped in some friends that are familiar with laravel, but we weren’t able to figure out how to do this yet. But haven’t given up.
#!/bin/bash
# /usr/lib64/nagios/plugins/check_zammadhelpdeskqueue.sh
# https://gist.github.com/maxcnunes/9f77afdc32df354883df
# https://www.howtoforge.com/tutorial/write-a-custom-nagios-check-plugin/
URL="https://helpdesk.example.com/api/v1/tickets/search?query=owner.id%3A1%20AND%20group.id%3A1%20AND%20state.name%3A(%22new%22%20OR%20%22open%22%20OR%20%22pending%20reminder%22)"
BEARER="blablabla"
# store the whole response with the status at the and
HTTP_RESPONSE=$(curl --url $URL --header "Authorization: Bearer $BEARER" --silent --write-out "HTTPSTATUS:%{http_code}")
# extract the body, then extract ticket_count value from the JSON
HTTP_BODY=$(echo $HTTP_RESPONSE | sed -e 's/HTTPSTATUS\:.*//g' | jq '.tickets_count')
# extract the status
HTTP_STATUS=$(echo $HTTP_RESPONSE | tr -d '\n' | sed -e 's/.*HTTPSTATUS://')
# if HTTP status is 200 OK, then return ticket_count
if [ $HTTP_STATUS -eq 200 ]; then
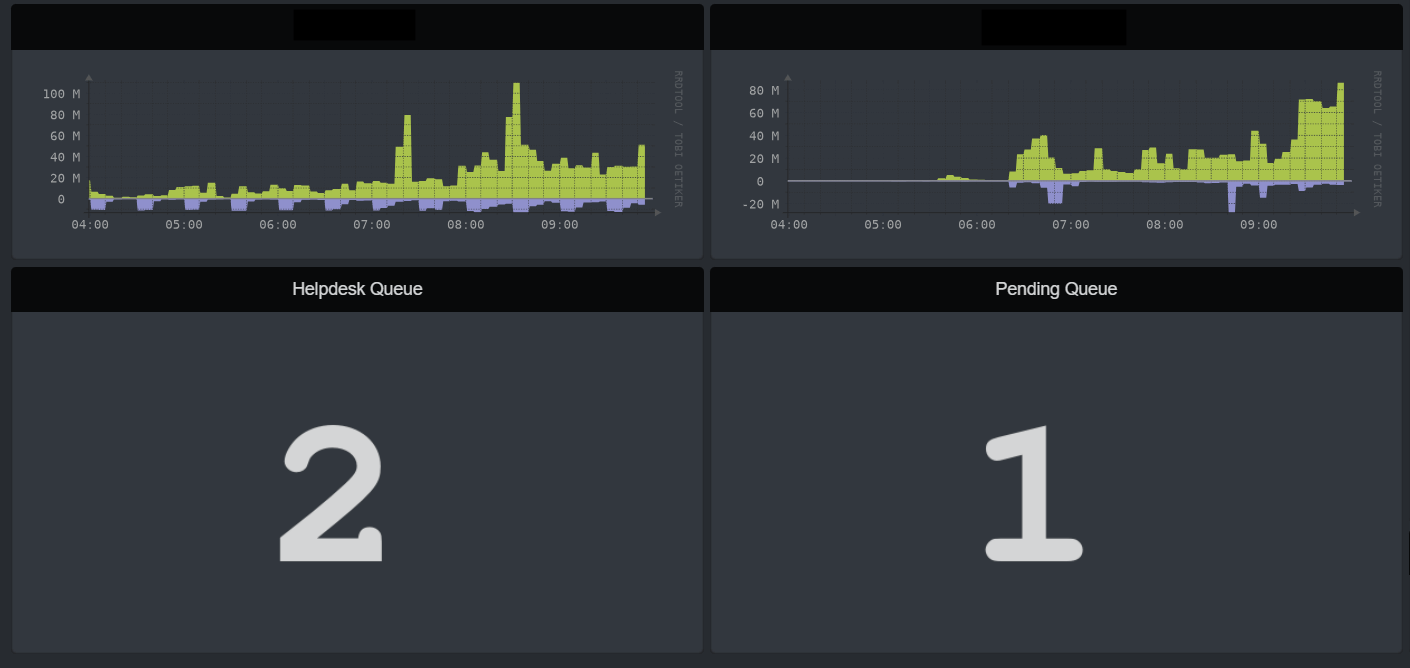
convert -size 550x275 -background none -fill white -gravity center -font Courier-Bold label:$HTTP_BODY /opt/librenms/html/images/helpdesk_queue.png
convert -size 550x275 -gravity center -font Courier-Bold label:$HTTP_BODY /opt/librenms/html/images/helpdesk_queue.svg
echo "$HTTP_BODY tickets in Helpdesk queue with no Owner | 'tickets'=$HTTP_BODY"
exit 0
fi
# if HTTP status is not 200 OK, exit with warning state
if [ ! $HTTP_STATUS -eq 200 ]; then
echo "Error [HTTP status: $HTTP_STATUS]"
exit 2
fi