Hi, I have a device (Juniper SRX220) that I am setting the % warn value for a storage device to 100%. Every night it seems to be getting reset to 60%. In looking at the event log, it appears like certain attributes of the device are getting removed and then 6ish hours later getting re-added. I’m assuming this has something to do with discovery process. That said, I don’t see anything about the storage device in the event log. Any hints as to what might be going on or how to debug it? Thanks. – Bud
Just another data point.
There is a 6 hour gap in some of the charts for the device too:
Processor, Memory, Disk Usage, Temperature, State, the ports.
Some charts seem fine:
Running Processes, Users Logged in, System Uptime.
Please run . /validate.php and pastebin the output.
Thank you
Sorry, meant to include this originally…
====================================
| Component | Version |
|---|---|
| LibreNMS | 1.32-4-ga1d7826 |
| DB Schema | 209 |
| PHP | 5.5.9-1ubuntu4.20 |
| MySQL | 5.5.52-MariaDB-1ubuntu0.14.04.1 |
| RRDTool | 1.4.7 |
| SNMP | NET-SNMP 5.7.2 |
====================================
[OK] Database connection successful
[OK] Database schema correct
Use Pastebin and post the output of the discovery and poller for this device.
discovery.php: https://pastebin.com/RP1p09zr
poller.php: https://pastebin.com/Yt4t69Sj
try ./discovery.php -r -f -h HOSTNAME -d
That last discovery doesn’t show any storage being removed and/or added.
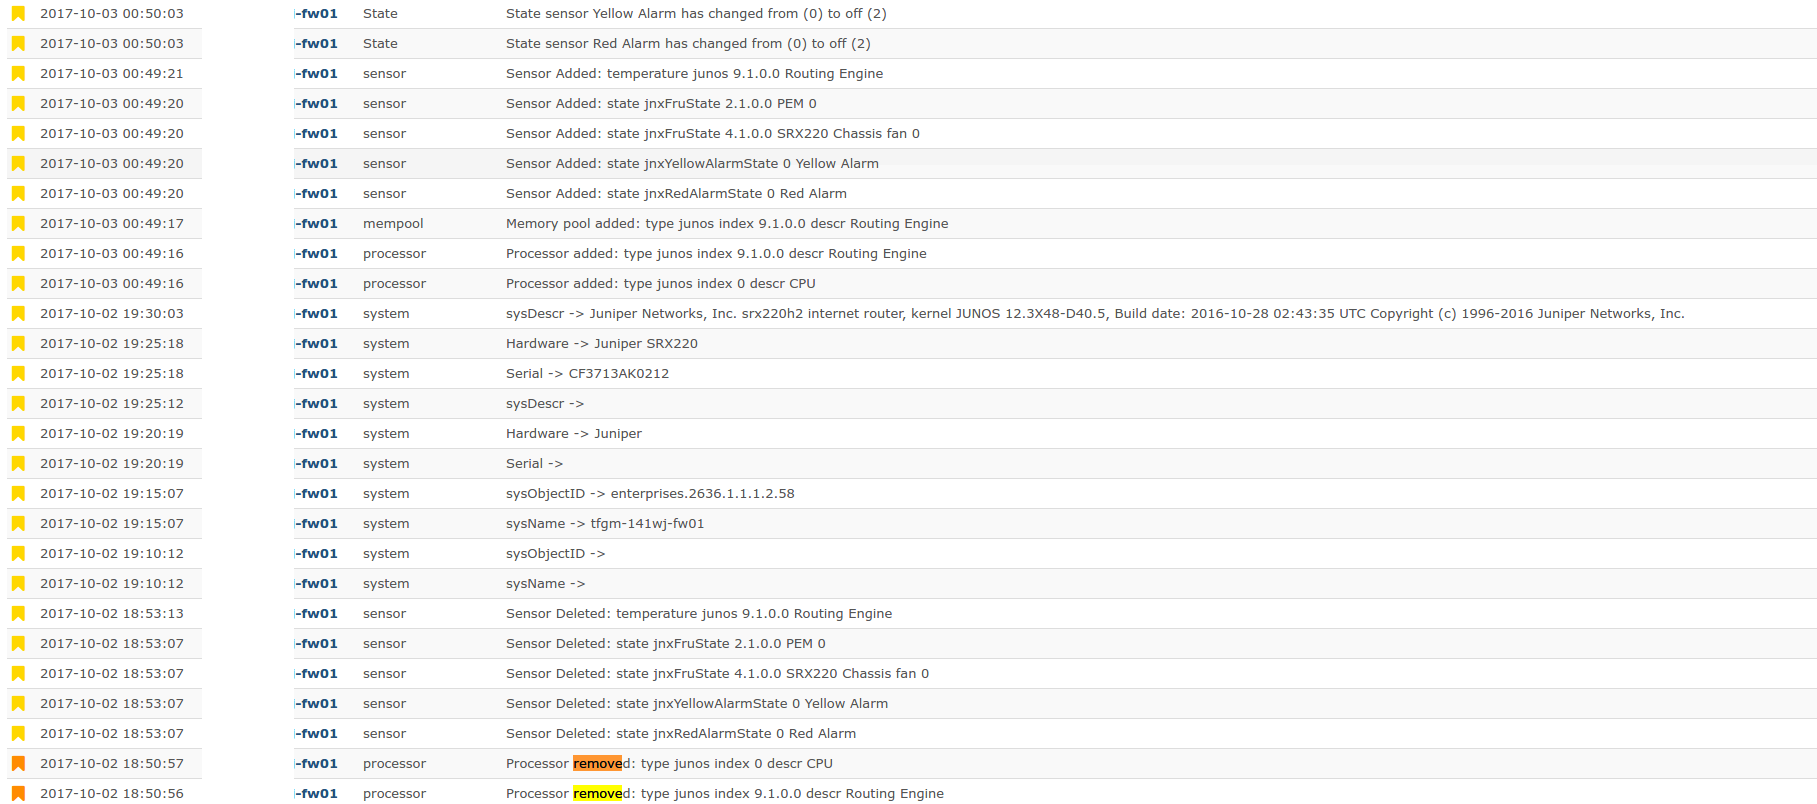
Can you post the screenshot of the eventlog showing the storage changes?
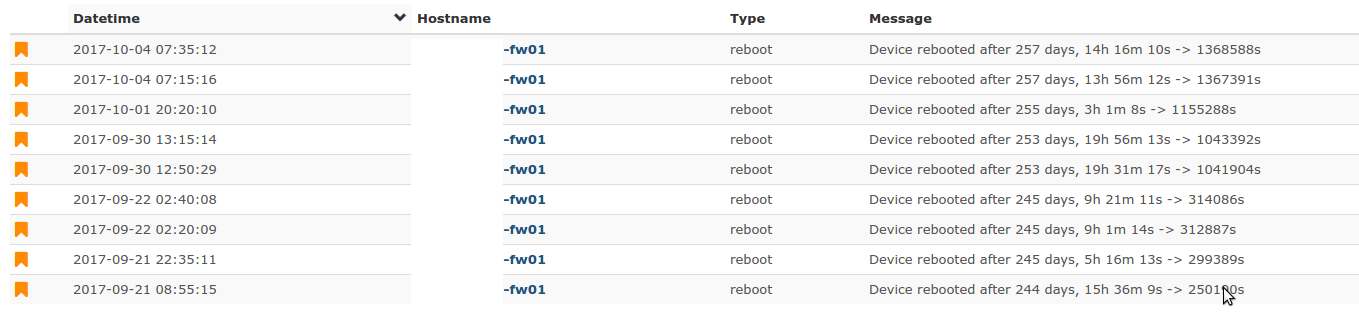
So I’m wondering if the device is slow to respond and librenms gives up on it. Below, you can see a number of “reboots” but the device has not rebooted (look at the “after days”):
That’s the processor not storage, which is it that’s not working?
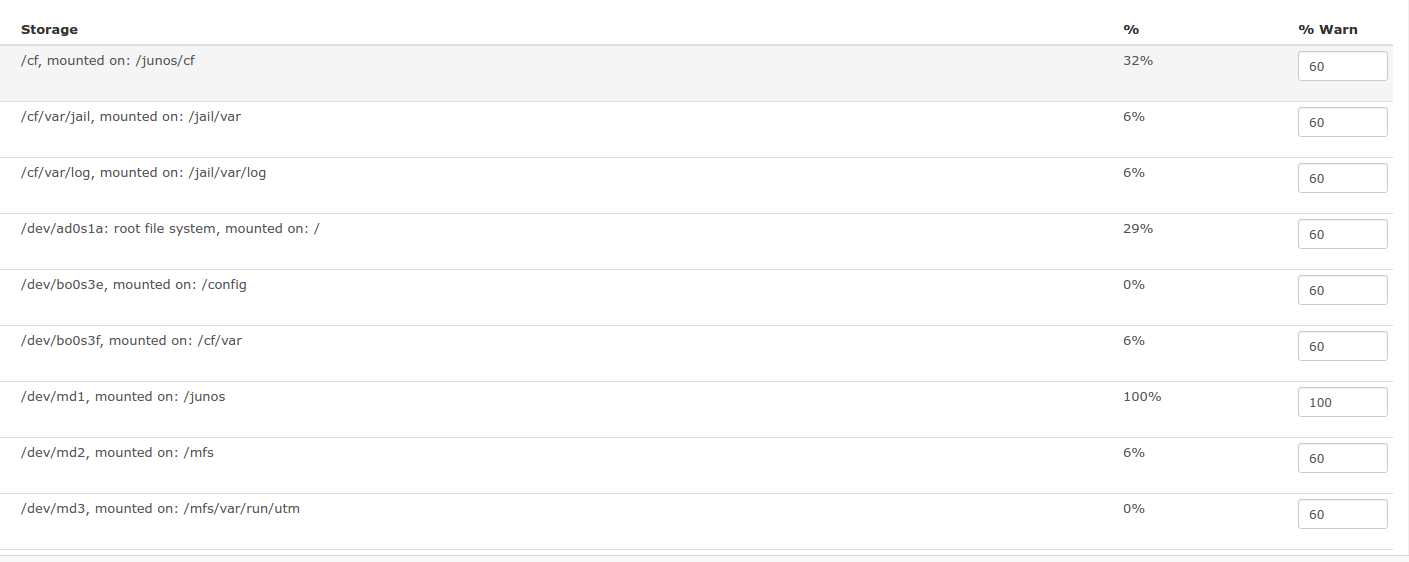
I never see the storage getting deleted in the event log. The symptom is the %warn gets reset from my user defined 100 back to the default 60 (currently set to 100):
Here is the poller graph for that device which is interesting:
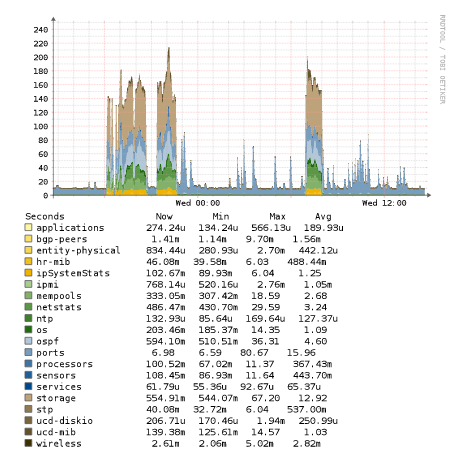
CPU spikes around those times too. Also, during those spikes, the storage device in question /junos show zero use (even though it is 100% used).
Most of the time when I see that behavior, the snmp response is truncated. So it may be an snmp bug in the device or a bad network connection.
A firmware update may fix this.
If you can verify this is not a network connectivity issue, you may need to open a ticket with Juniper support.
OK, Thanks Tony. – Bud
As an FYI, I found out I could restart the snmp process on junos with “restart snmp”. Going to see if that clears up the issue at all.
The ‘restart snmp’ seems to have helped this device. CPU never went over 75% on the last discovery and previously it was running at 100%. No weird gaps on any charts last night and nothing in the eventlog so it seems much better. We’ll see over the next few days… Thanks for your help! – Bud
One more update. The ‘restart smnp’ did not actually help. Still seems like there is an issue with snmp responses from this device.  Probably the SRX…