@laf@murrant anymore settings that i can make? i mean, there is a difference we all see, right?
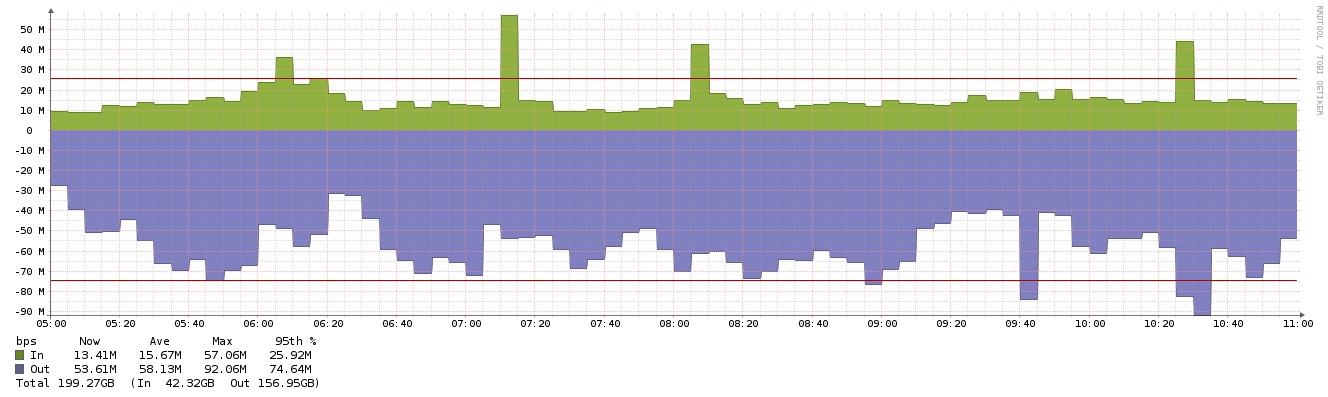
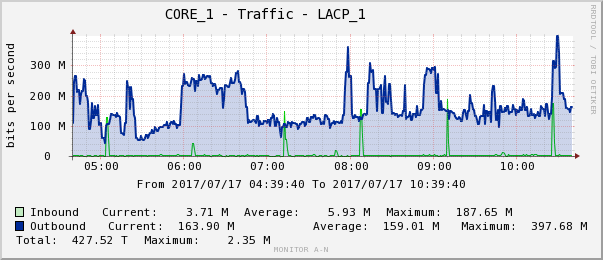
if i look closely: current and average values are very close and not a problem, but on every graph the maximum value is a huge difference: i.e. core 1 - inbound - maximum cacti 187mbps in libre 46 mbps…
@laf no, i did not. in the tutorial it says that all new graphs from the moment i make the change it will be taken effect. will do today anyway. to see if there is a difference.
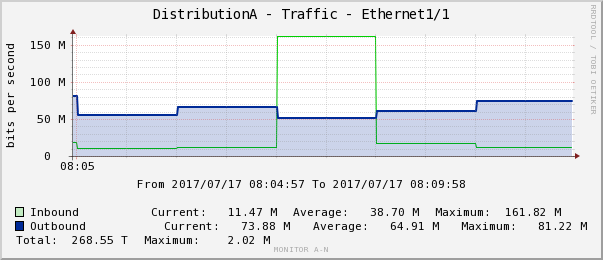
this is what happened after i convert the rrd files:
Why did you set poller-wrapper.py to 1? That means only one device can be polled at a time.
You need to run the script as laf mentioned or delete all existing data in the rrd folder.
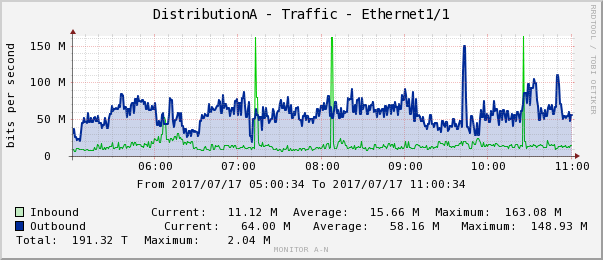
Let me explain how traffic graphs work:
Each port reports the number of bytes transferred since boot via SNMP (ifInOctets and ifOutOctets).
LibreNMS (and Cacti) collect that number and store it in RRD without modification.
LibreNMS (and Cacti) displays the graph generated by RRD.
Important points ifInOctets and ifOutOctets always increase and NEVER decrease.
The transfer rate (as displayed in the graph) is simply current reading - previous reading / time between readings
This means if the start and/or stop time or the time between readings are different, the amount of bytes transferred during that window are likely to be different.
You could have two LibreNMS (or two Cacti instances) and if they started polling at different times, they would show different graphs.
You must also change your cron entry for poller-wrapper.py for this to work (if you change from the default 300 seconds).
also:
Step is how often you want to insert data, so if you change to 1 minute polling then this should be 60.
Heartbeat is how long to wait for data before registering a null value, i.e 120 seconds.