Difference in graphics between cacti and librenms

Hello,

here is my validate.php:

system: Centos 7

problem:
i had someone who setup cacti. now i want to change from cacti to librenms.
installing went fine and i added some of the equipment (core 1+2 and distribution 1+2)
the admin who set up cacti said that librenms doesn’t show the graphics properly. There are differences.

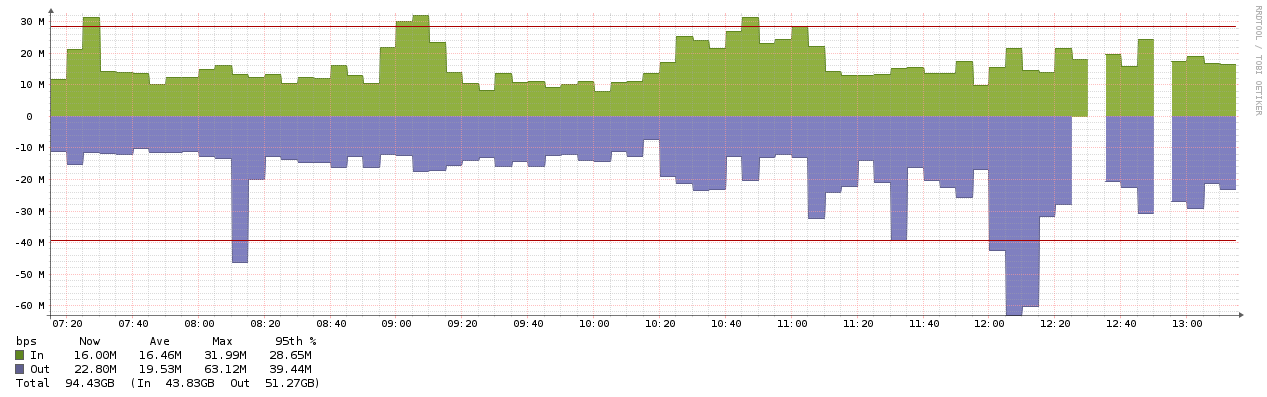
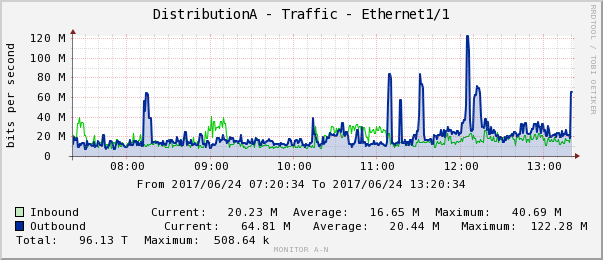
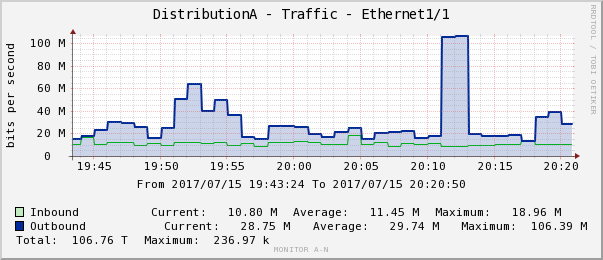
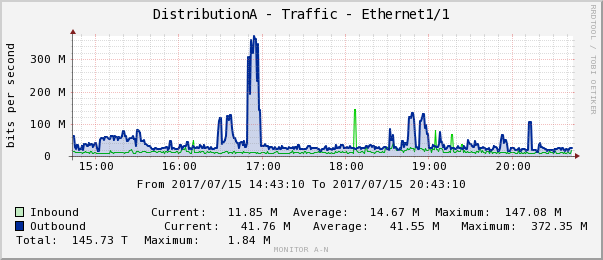
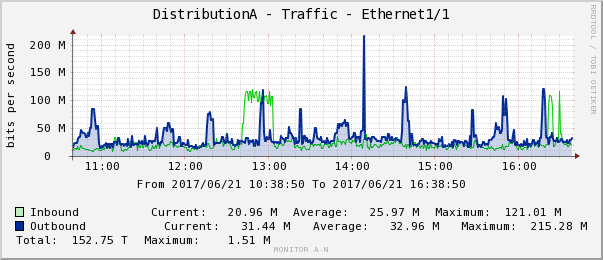
for example - Distribution 1 - Ethernet port 1/1 - last 6 hours:
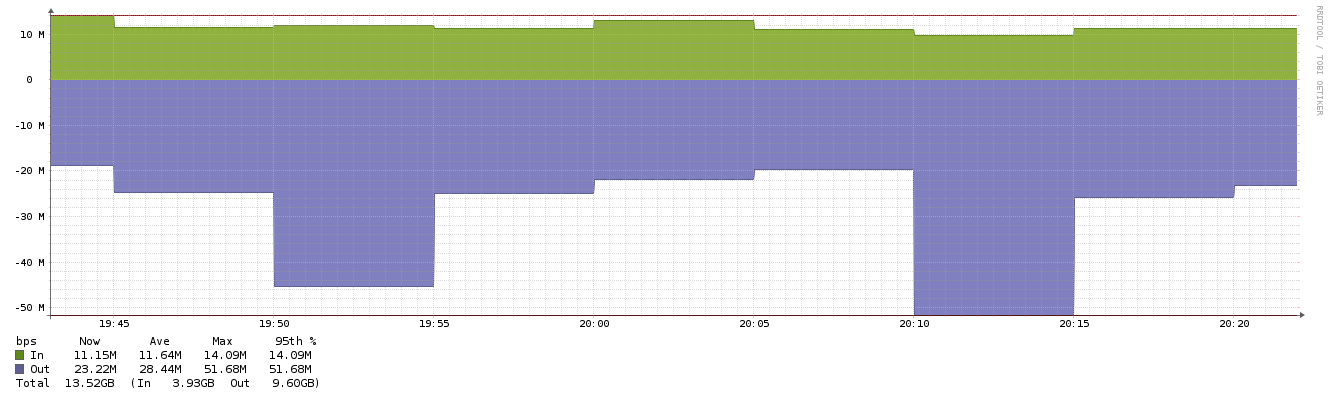
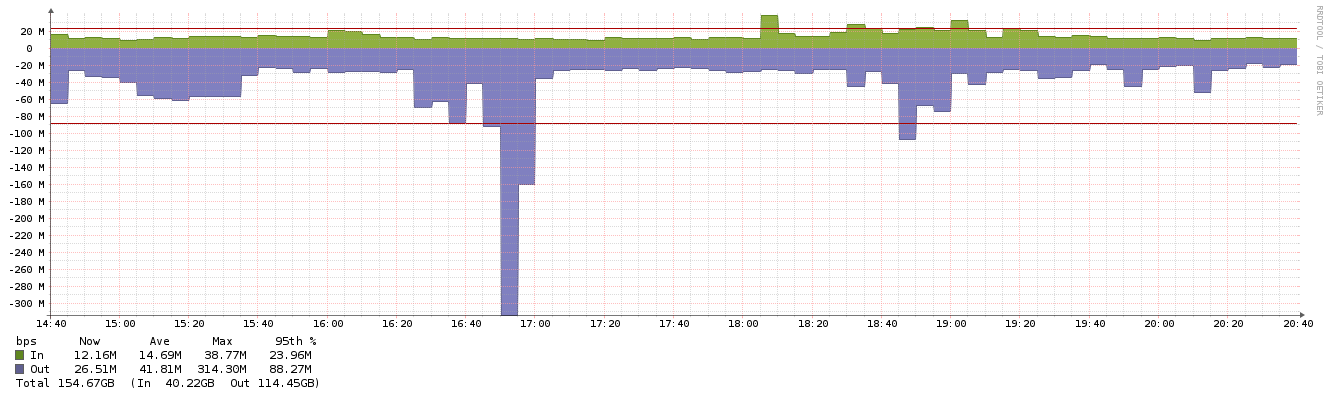
librenms:


cacti:

the distribution as equpiment was put by the admin. He said that there must be a bug by librenms that there are those differences.
i don’t now where to look… could be that the RRD-file are messed up? but then i ask myself how can it be… both servers are on snmp v2 and both should get the same informations.

if someone can tell me where to look so i can find where the differences are, would be great.

What is the cacti polling frequency?

And are Distribution A and Distribution 1 the same device?

It also, looks like you have some gaps in your LibreNMS data, so can you check the poller log and graph?

Thank you for your prompt reply.

If you tell me where to look i can give you all the details :slight_smile:

Go to the device, click graphs, click poller.

poller data from librenms:


poller frecvency on cacti:
15sec

Looks like 32bit counter overflow to me. What is the device you’re graphing?

VDS in SolusVM - 2 core - 3GB mem

ah… i think you mean the device:
cisco nexus 3064 as distribution
Arista 7050QX as core router.

No, it is a data resolution difference I think. 15 seconds vs 5 minutes

When you don’t index spikes in graph it’s the bit’s, then may be the poller and after that rrd’s :wink: Why does not your admin try to search for the problem ?

i’ve changed to 15 seconds. we’re going to see if it changes something…

@ScaryDude
he doesn’t want to change to librenms and doesn’t want to help me, so i’m doing it on my own… and i don’t have much experience :smiley:

how can i change the poller timer for each equipment seperately?

example:
15 sec on distribution
30 sec on core router?

Well you should see difference in 1 hour if not it’s other problem. Check your stats on poller.

Anyway about your admin, why don’t you change him if he does not help you, I have changed 2 until now …

You can only change the overall interval. But be careful when doing so.

http://docs.librenms.org/Support/1-Minute-Polling/

thank you murrant. it helped but it’s not complete. overall it’s ok but some values (example some spikes) are not correct.

i have made some changes:

Change the rrd step value: 15 sec
Change the rrd heartbeat value: 30 sec

/etc/cron.d/librenms

[root@localhost ~]# nano /etc/cron.d/librenms
GNU nano 2.3.1 File: /etc/cron.d/librenms

33 */6 * * * librenms /opt/librenms/discovery.php -h all >> /dev/null 2>&1
*/5 * * * * librenms /opt/librenms/discovery.php -h new >> /dev/null 2>&1
*/1 * * * * librenms /opt/librenms/cronic /opt/librenms/poller-wrapper.py 16

(#) */1 * * * * sleep 00; librenms /opt/librenms/cronic /opt/librenms/poller-wrapper.py 16
(#) */1 * * * * sleep 15; librenms /opt/librenms/cronic /opt/librenms/poller-wrapper.py 16
(#) */1 * * * * sleep 30; librenms /opt/librenms/cronic /opt/librenms/poller-wrapper.py 16
(#) */1 * * * * sleep 45; librenms /opt/librenms/cronic /opt/librenms/poller-wrapper.py 16

15 0 * * * librenms /opt/librenms/daily.sh >> /dev/null 2>&1

          • librenms /opt/librenms/alerts.php >> /dev/null 2>&1
            */5 * * * * librenms /opt/librenms/poll-billing.php >> /dev/null 2>&1
            01 * * * * librenms /opt/librenms/billing-calculate.php >> /dev/null 2>&1
            */5 * * * * librenms /opt/librenms/check-services.php >> /dev/null 2>&1
            */5 * * * * librenms /opt/librenms/html/plugins/Weathermap/map-poller.php >> /dev/null 2>&1

if i try with sleep i get this error:

(sleep) ERROR (getpwnam() failed)

so i commented them out for now…

furthermore:

on distribution when i hit the APPs Tab i get the error:

NTP is not in sync

ouput from ntpdate -pn

 remote           refid      st t when poll reach   delay   offset  jitter

=================================================================
x82.77.52.43 127.0.0.1 12 u 459 1024 377 12.219 386.470 14.269
x185.173.16.132 43.77.130.254 2 u 358 1024 377 1.044 0.727 3.633

(even though i don’t think that it has something to do with graphics)

here are the graphics for comparisson:


last but not least poller:


everything from the last 6 hours. thoughts? guidance?

My progress so far:

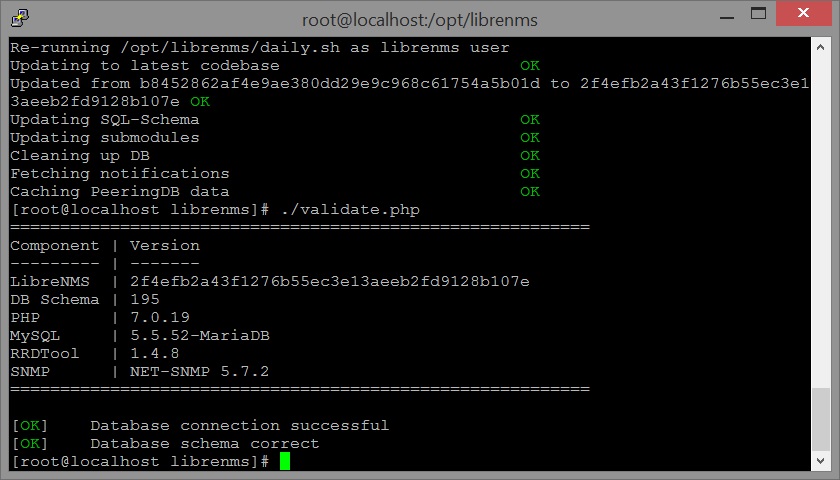
reinstalled librenms. left it untouched for a period of time (just added devices). RRD step was too high so i tuned it down to 100 and heartbeat to 200 (network blocked snmp because rrd step was too high). Polling otherwise is ok and works perfectly fine. all equipment go with snmp v2.

Graph are almost the same. still, i’m not really where i want it to be. Can it be that librenms is cutting spikes automatically? still wouldn’t explain the differences between the graphs if i zoom it in. why is it inacurate?

Example:

between 20:10 and 20:15 i have in cacti 100mbps and in librenms only 50mbps
between 19:50 and 19:55 the graph doesn’t look at all the same. the values are also completely different.

Example 2: (past 6 ours)

almost the same. a little bit past 18:00 i’m missing the spike where in cacti in goes to 100mbps and in librenms only 20mbps. at 16:45 (behind the 300mbps bar) there should be the graph value higher and not on the average red line.

it’s not very accurate. @murrant can you help me make librenms more accurate in graph?
(btw. this problem is for every device. not only this one)

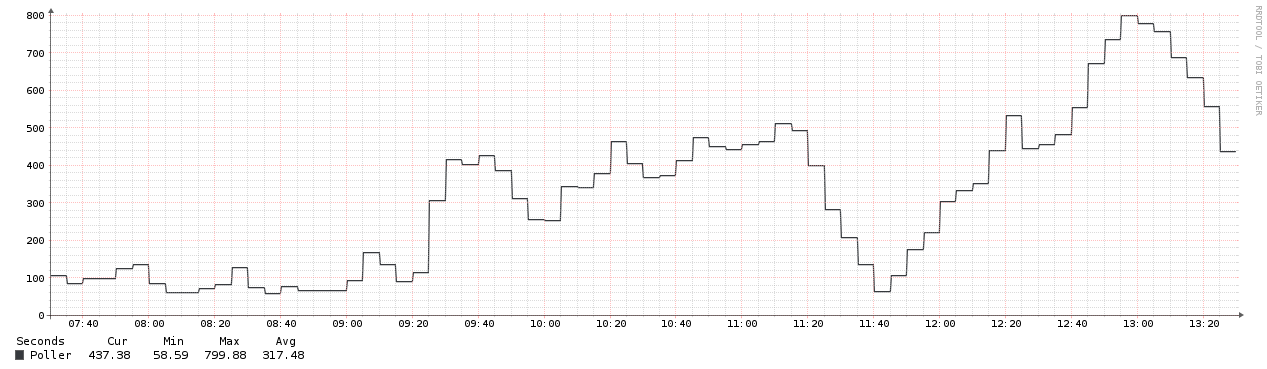
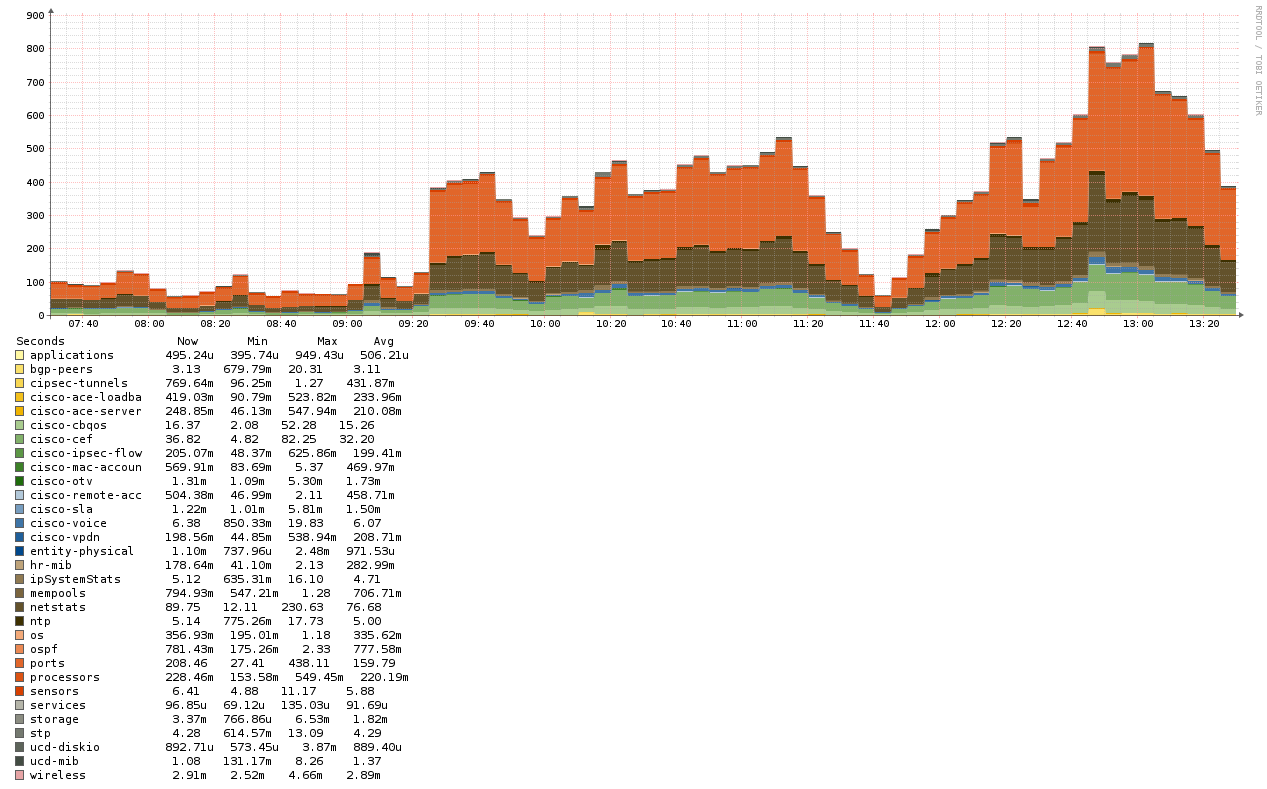
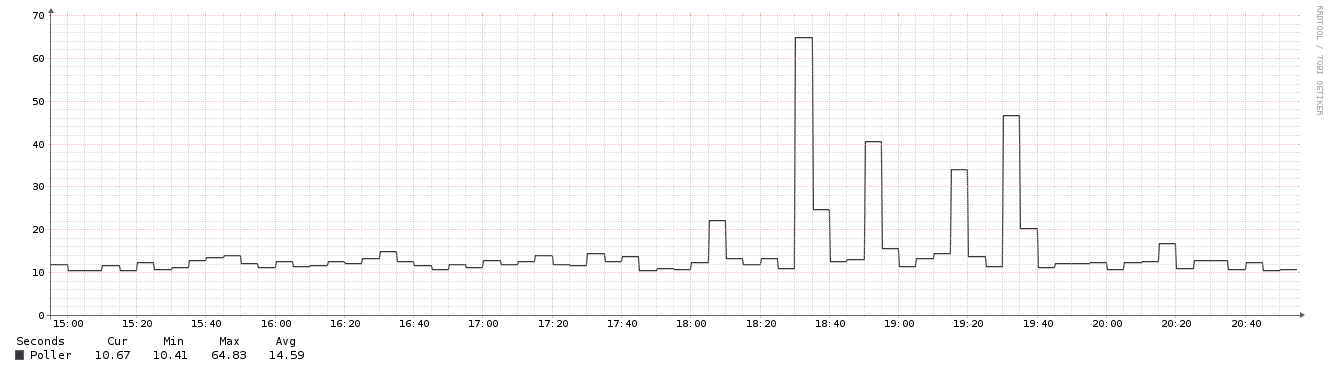
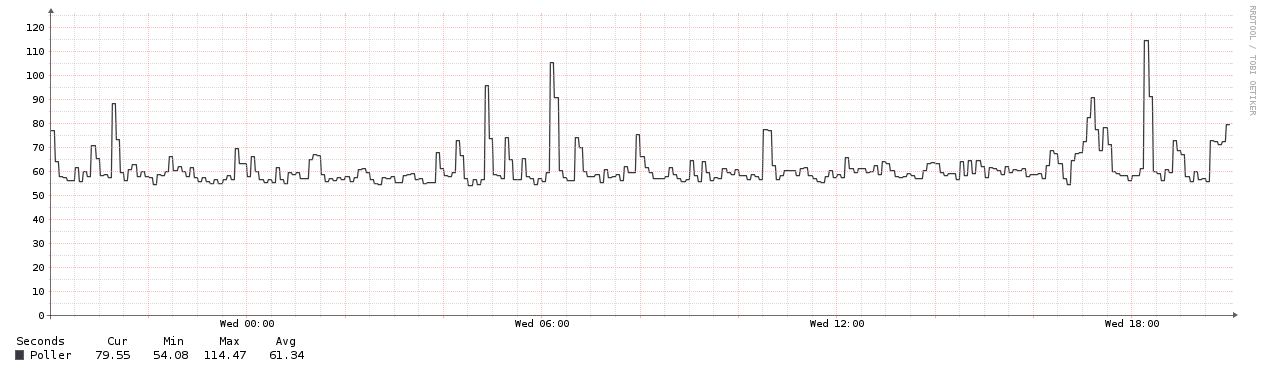
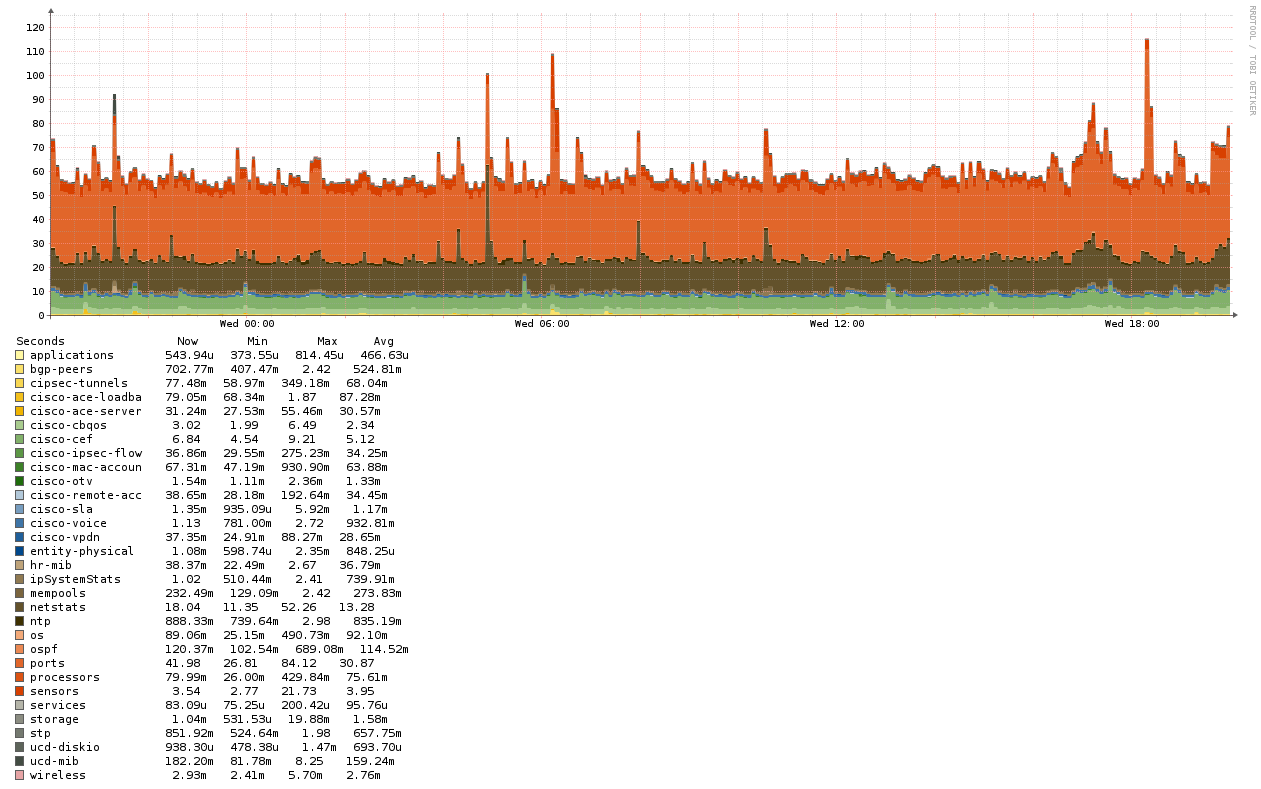
poller in distribution should be around 15sec. so polling is fine i guess.

Looks accurate to me.

Think about this. If you transfer 750 Megabytes in one minute, but 0 bytes the other 4 minutes of that 5 minute interval what is the transfer rate for the 1 minute interval and the 5 minute interval? 100Mbps and 20Mbps.

LibreNMS is accurate, but you are measuring rate over a period of time with different periods of time :slight_smile: You are not measuring the peak transfer rate during the time period, but the average (in both Cacti and LibreNMS)

So to compare apples to apples. Add all 5 1 minute intervals from Cacti, then divide by 5.

@murrant if i lower the interval rates in librenms (to 1 min) like in cacti then i should have the same values in graphs?

so, if i’m correct, i just have to modify the crond poller-wrapper.py to 1 min right?

Correct, the values will be the same (and both are accurate right now) if you switch to 1 minute polling.

Switching to 1 minute polling is not that simple, see http://docs.librenms.org/Support/1-Minute-Polling/ and http://docs.librenms.org/Support/Performance/

Remember that LibreNMS polls more data than Cacti :slight_smile:

Also you are assuming that we ask for the data at the same time as cacti which is most likely not the case, therefore you can expect the device to give us different data back, especially if traffic is bursty.

1 Like

@laf @murrant that wouldn’t be the problem. if it’s close as possible then i’m ok. i changed cron poller-wrapper from 5 to 1 and rrd to 60 and heartbeat to 120 sec. i’ll see tomorrow how the graph will change.
my goal is that the graph is as close to reality as possible. i don’t want that librenms is equally to cacti. but i hope that it’s close so i won’t get fooled if something happens.
furthermore i want to build on it and give it to clients so they can monitor their servers. but i need to know that graphing works properly and is as close to reality as it gets. if the graphing is 30-60 mbps short, then that’s a problem because that’s not reliable. (example some client goes rogue and makes constantly more traffic than contractual defined. i need to proof. if he does 150mbps but libre shows only 100mbps then i can’t make him pay for the extra traffic)

that’s what and why i’m struggling here. it may not be your concern but still saying so you understand my situation.

darkfritz2 You should probably use 95 percentile for billing. Also, we billing functionality built in.