Hi,
I have got the problem about the graph discontinuous and gateway timeout , Could someone guild me to start the investigation?
Below is my captured information.
./daily.sh
Could not connect to database, check logs/librenms.log.
Could not connect to database, check logs/librenms.log.
Updating to latest codebase OK
Updating Composer packages OK
Updated from cfb70f73d to 473a7d360 OK
Updating SQL-Schema OK
Updating submodules OK
Cleaning up DB OK
Fetching notifications OK
Caching PeeringDB data OK
Caching Mac OUI data OK
You have mail in /var/mail/librenms
++++++++++++++++++++++
./validate.php
| Component | Version |
|---|---|
| LibreNMS | 23.2.0-41-g473a7d360 (2023-03-19T10:07:52+07:00) |
| DB Schema | 2023_03_14_130653_migrate_empty_user_funcs_to_null (249) |
| PHP | 8.1.2-1ubuntu2.11 |
| Python | 3.10.6 |
| Database | MariaDB 10.6.12-MariaDB-0ubuntu0.22.04.1 |
| RRDTool | 1.7.2 |
| SNMP | 5.9.1 |
| =========================================== |
[OK] Composer Version: 2.5.4
[OK] Dependencies up-to-date.
[OK] Database connection successful
[OK] Database Schema is current
[OK] SQL Server meets minimum requirements
[OK] lower_case_table_names is enabled
[OK] MySQL engine is optimal
[OK] Database and column collations are correct
[OK] Database schema correct
[OK] MySQl and PHP time match
[OK] Active pollers found
[OK] Dispatcher Service not detected
[OK] Locks are functional
[OK] Python poller wrapper is polling
[OK] Redis is unavailable
[OK] rrdtool version ok
[OK] Connected to rrdcached
You have mail in /var/mail/librenms
Example of the graph:
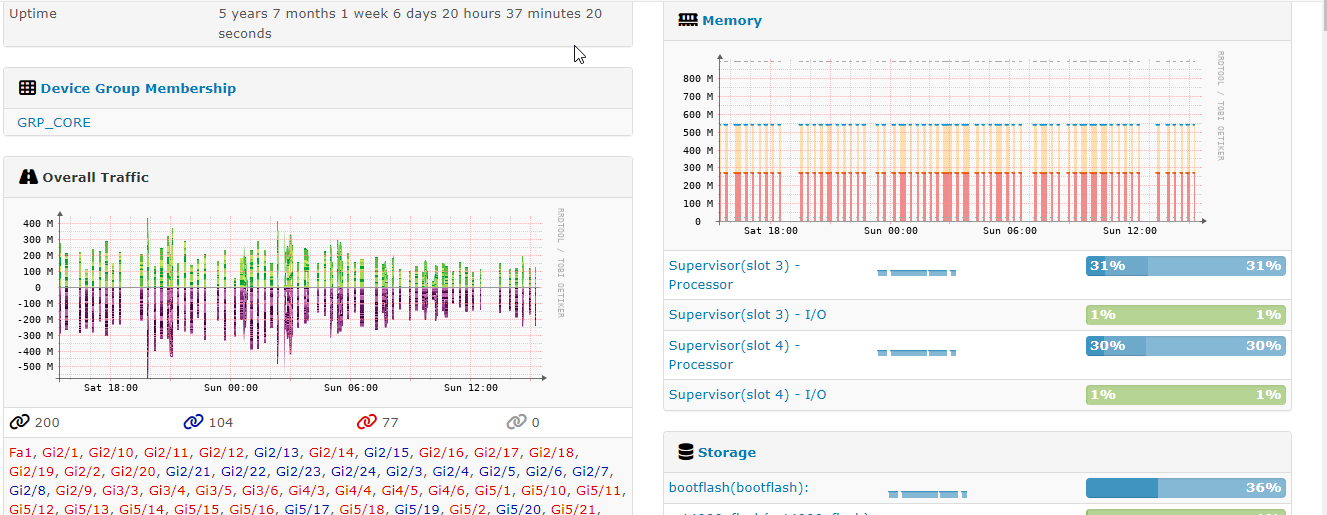
CPU/Memory Utilization:

Gateway timeout error: