Hello,
There is an issue with Cisco Nexus N9K-C93240YC-FX2 where sometimes values are way too high for no reason, like here:
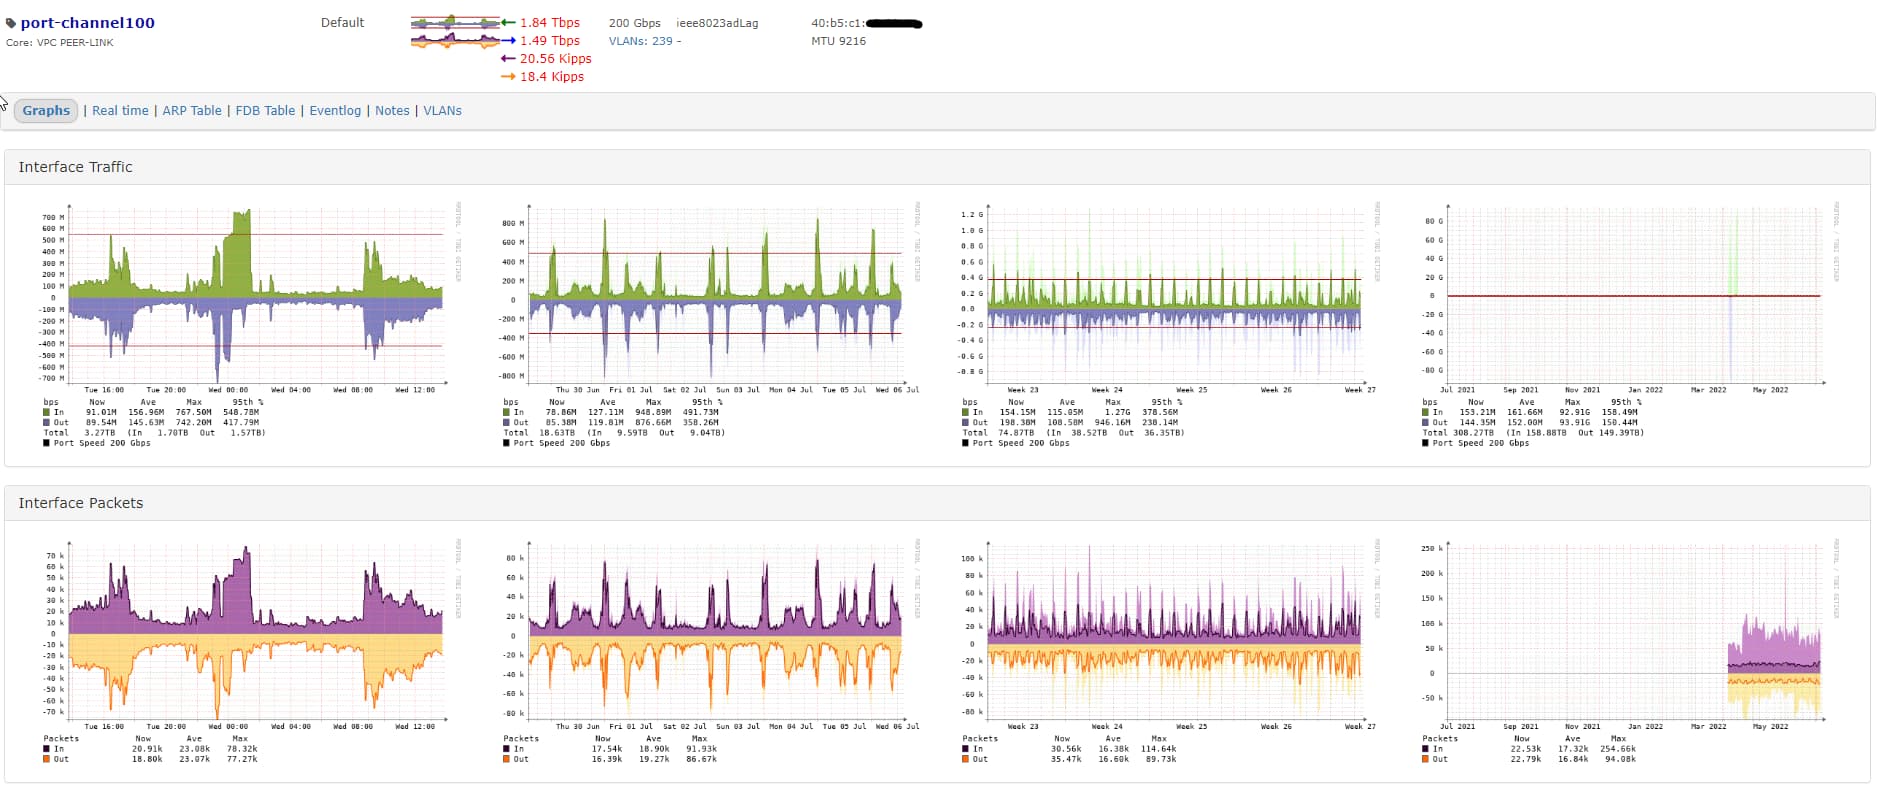
Bandwidth graph seems OK but numbers asides are way too high and trigger bandwidth threshold alerting. It looks like the per second valus is the per 24h value.
I’m not really sure how to reproduce, it happens maybe once a week, only on Cisco Nexus.
If that can help, we are doing Cisco-like mLAG (port-channel with vPc), but it happens on vPc port itself too (it is a standard port-channel)
Does someone know where it comes from, and / or how to fix it?
$ ./validate.php
====================================
Component | Version
--------- | -------
LibreNMS  | 22.6.0-19-g24fc12722
DB Schema | 2022_05_30_084932_update-app-status-length (242)
PHP       | 7.4.30
Python    | 3.6.8
MySQL     | 10.8.3-MariaDB
RRDTool   | 1.7.0
SNMP      | 5.8
====================================

[OK]    Composer Version: 2.3.7
[OK]    Dependencies up-to-date.
[OK]    Database connection successful
[OK]    Database Schema is current
[OK]    SQL Server meets minimum requirements
[OK]    lower_case_table_names is enabled
[OK]    MySQL engine is optimal
[OK]
[OK]    Database schema correct
[OK]    MySQl and PHP time match
[OK]    rrdtool version ok
[OK]    Connected to rrdcached