Docker Container Memory usage, % not graphing

Hello,

I have run into an issue with the docker-stats.sh script - the Container Memory usage, % graph is showing as nan, even though the values are being returned to LibreNMS. This is using the SNMP extend method as laid out in the documentation ( Applications - LibreNMS Docs).

The Docker output on the host shows the memory usage in %:

CONTAINER ID NAME CPU % MEM USAGE / LIMIT MEM % NET I/O BLOCK I/O PIDS
b7a319ab3de7 rtorrent_logs 0.01% 1.68MiB / 3.705GiB 0.04% 50.5kB / 0B 3.62MB / 0B 1
bf7957ccd0ae rtorrent 19.09% 340.9MiB / 3.705GiB 8.98% 21.5GB / 555GB 416MB / 2.19GB 150
d90c96420abe rtorrent_geoip 0.00% 28.7MiB / 3.705GiB 0.76% 133MB / 1.48MB 389MB / 259MB 10

The script output run locally on the same host as the SNMP user:

root@pi:/home/# sudo -u Debian-snmp /etc/snmp/docker-stats.sh
{“version”:“1”,“data”:[{“container”:“rtorrent_logs”,“pids”:1,“memory”:{“used”:“1.68MiB”,“limit”:“3.705GiB”,“perc”:“0.04%”},“cpu”:“0.01%”},{“container”:“rtorrent”,“pids”:150,“memory”:{“used”:“350.8MiB”,“limit”:“3.705GiB”,“perc”:“9.25%”},“cpu”:“2.13%”},{“container”:“rtorrent_geoip”,“pids”:10,“memory”:{“used”:“28.86MiB”,“limit”:“3.705GiB”,“perc”:“0.76%”},“cpu”:“0.00%”}],“error”:“0”,“errorString”:“”}

From this I assume the script runs correctly and retrieves the correct values.

Debugging on the LibreNMS host shows that the values are being received:

.1.3.6.1.4.1.8072.1.3.2.3.1.1.6.100.111.99.107.101.114 = STRING: “{"version":"1","data":[{"container":"rtorrent_logs","pids":1,"memory":{"used":"1.68MiB","limit":"3.705GiB","perc":"0.04%"},"cpu":"0.01%"},{"container":"rtorrent","pids":150,"memory":{"used":"340.7MiB","limit":"3.705GiB","perc":"8.98%"},"cpu":"0.57%"},{"container":"rtorrent_geoip","pids":10,"memory":{"used":"28.86MiB","limit":"3.705GiB","perc":"0.76%"},"cpu":"0.00%"}],"error":"0","errorString":""}”

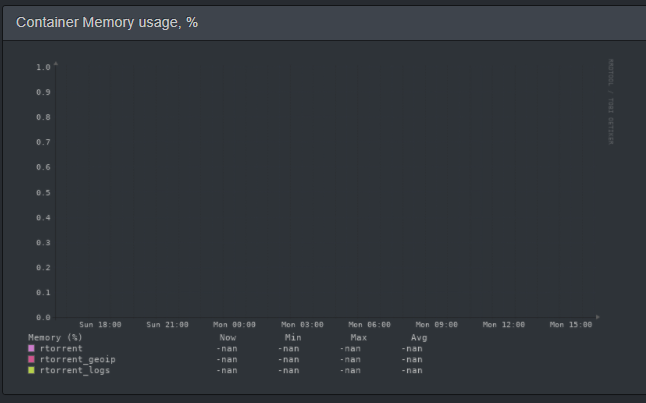
This suggests that LibreNMS is receiving the values from the script correctly, but the graph does not populate:

docker graph

Docker is running on a Raspberry Pi 4; I asked a friend earlier and he was able to reproduce this on his Pi, as well as on an x86 machine. Just to reiterate, this is the only Docker graph which is not drawing - the others are all correct.

Output of validate.php:

librenms@LibreNMS:/root$ /opt/librenms/validate.php

Component Version
LibreNMS 21.12.1-11-g6dc3e4217
DB Schema 2021_11_29_165436_improve_ports_search_index (229)
PHP 7.4.25
Python 3.9.2
MySQL 10.5.12-MariaDB-0+deb11u1
RRDTool 1.7.2
SNMP 5.9
====================================

[OK] Composer Version: 2.2.3
[OK] Dependencies up-to-date.
[OK] Database connection successful
[OK] Database schema correct

It seems to me that the system does not know what to do with the value or how to interpret it - any assistance would be much appreciated.

Can you post the output of ./poller.php -h HOSTNAME -d -v -m applications

Hi laf,

Sure, pasted here: Untitled - LibreNMS

Hopefully I have done it right, happy to assist where I can with whatever testing or output.

So that indicates it’s updating the rrd file correctly, can you click the graph → show command and copy/paste the command pls?

Sure, here we go (again hopefully I have done this right):

rrdtool graph /tmp/dJByPg81fRCA1Rex --alt-autoscale-max --rigid -E --start 1641848700 --end 1641935154 --width 2559 --height 738 -c BACK\#EEEEEE00 -c SHADEA\#EEEEEE00 -c SHADEB\#EEEEEE00 -c CANVAS\#FFFFFF00 -c GRID\#292929 -c MGRID\#2f343e -c FRAME\#5e5e5e -c ARROW\#5e5e5e -R normal -c FONT\#bfc0c0 --font LEGEND:8:DejaVuSansMono --font AXIS:7:DejaVuSansMono --font-render-mode normal COMMENT:'Memory \(%\) Now Min Max Avg\\l' COMMENT:'\\l' DEF:mem_perc1=OSMC/app-docker-10-rtorrent.rrd:mem_perc:AVERAGE DEF:mem_perc1min=OSMC/app-docker-10-rtorrent.rrd:mem_perc:MIN DEF:mem_perc1max=OSMC/app-docker-10-rtorrent.rrd:mem_perc:MAX CDEF:mem_perc_cdef1=mem_perc1,100,/ CDEF:mem_perc_cdef1min=mem_perc1min,100,/ CDEF:mem_perc_cdef1max=mem_perc1max,100,/ LINE2:mem_perc_cdef1\#CC7CCC:'rtorrent ' GPRINT:mem_perc_cdef1:LAST:%8.0lf%s GPRINT:mem_perc_cdef1min:MIN:%8.0lf%s GPRINT:mem_perc_cdef1max:MAX:%8.0lf%s GPRINT:mem_perc_cdef1:AVERAGE:'%8.0lf%s\\n' COMMENT:'\\n' DEF:mem_perc2=OSMC/app-docker-10-rtorrent_geoip.rrd:mem_perc:AVERAGE DEF:mem_perc2min=OSMC/app-docker-10-rtorrent_geoip.rrd:mem_perc:MIN DEF:mem_perc2max=OSMC/app-docker-10-rtorrent_geoip.rrd:mem_perc:MAX CDEF:mem_perc_cdef2=mem_perc2,100,/ CDEF:mem_perc_cdef2min=mem_perc2min,100,/ CDEF:mem_perc_cdef2max=mem_perc2max,100,/ LINE2:mem_perc_cdef2\#D0558F:'rtorrent_geoip ' GPRINT:mem_perc_cdef2:LAST:%8.0lf%s GPRINT:mem_perc_cdef2min:MIN:%8.0lf%s GPRINT:mem_perc_cdef2max:MAX:%8.0lf%s GPRINT:mem_perc_cdef2:AVERAGE:'%8.0lf%s\\n' COMMENT:'\\n' DEF:mem_perc3=OSMC/app-docker-10-rtorrent_logs.rrd:mem_perc:AVERAGE DEF:mem_perc3min=OSMC/app-docker-10-rtorrent_logs.rrd:mem_perc:MIN DEF:mem_perc3max=OSMC/app-docker-10-rtorrent_logs.rrd:mem_perc:MAX CDEF:mem_perc_cdef3=mem_perc3,100,/ CDEF:mem_perc_cdef3min=mem_perc3min,100,/ CDEF:mem_perc_cdef3max=mem_perc3max,100,/ LINE2:mem_perc_cdef3\#B6D14B:'rtorrent_logs ' GPRINT:mem_perc_cdef3:LAST:%8.0lf%s GPRINT:mem_perc_cdef3min:MIN:%8.0lf%s GPRINT:mem_perc_cdef3max:MAX:%8.0lf%s GPRINT:mem_perc_cdef3:AVERAGE:'%8.0lf%s\\n' COMMENT:'\\n' --daemon unix:/var/run/rrdcached.sock

This sounds positive though!

What happens if you run that command in a shell?

Again assuming I have done this correctly… pasting the command into a shell yields the below:

ERROR: realpath(OSMC/app-docker-10-rtorrent.rrd): Permission denied

Which is strange, because the permissions look correct to me:

root@LibreNMS:~# ls -la /opt/librenms/rrd/OSMC/
total 59968
drwxrwxr-x+ 2 librenms librenms 12288 Jan 4 12:35 .
drwxrwxr-x+ 12 librenms librenms 4096 Dec 14 15:25 …
-rw-r–r-- 1 librenms librenms 849128 Jan 11 23:05 app-docker-10-rtorrent.rrd
-rw-r–r-- 1 librenms librenms 849128 Jan 11 23:05 app-docker-10-rtorrent_geoip.rrd
-rw-r–r-- 1 librenms librenms 849128 Jan 11 23:05 app-docker-10-rtorrent_logs.rrd
-rw-r–r-- 1 librenms librenms 171272 Jan 11 23:05 app-os-updates-12.rrd
-rw-r–r-- 1 librenms librenms 171272 Jan 11 23:05 availability-2592000.rrd
-rw-r–r-- 1 librenms librenms 171272 Jan 11 23:05 availability-31536000.rrd
-rw-r–r-- 1 librenms librenms 171272 Jan 11 23:05 availability-604800.rrd
-rw-r–r-- 1 librenms librenms 171272 Jan 11 23:05 availability-86400.rrd
-rw-r–r-- 1 librenms librenms 171272 Jan 11 23:05 hr_processes.rrd
-rw-r–r-- 1 librenms librenms 171272 Jan 11 23:05 hr_users.rrd

Output omitted for brevity, the other files inside the directory are all owned by the same user. So it seems to be a permissions issue somehow… not sure where to go from here.

You need to run the command in the /opt/librenms/rrd folder

My mistake, thank you for correcting me. Running from that folder prints out what looks like dimensions to me:

2640x891

That is the only output I receive from running that command in the shell.

I’m out of ideas at the moment and don’t have an IDE to go through debugging the code :frowning:

Would you say at the moment that it appears to be code related, and not as a result of misconfiguration on my part?

Would you prefer me to log this on Github and reference the thread for visibility and to get someone else involved?

It does look related to code as the debug comes back ok - you could try deleting the application-* rrd files to see if they get generated ok?

I’ve wiped the rrd files for Docker, everything regenerated - the ones which were working previously are working, the problematic one is still a problem.

So you have some devices generating the same graphs ok?

Not entirely sure I am clear on your question… I am only monitoring Docker containers on one single host at the moment (this will be expanded in future). There are five graphs in total provided:

  • PIDS [Working]
  • Container memory limit [Working]
  • Container memory used [Working]
  • Container CPU usage, % [Working]
  • Container Memory usage, % [Not working]

The ones which were working before wiping the rrd files have continued to work; the one which was broken before wiping the rrd files is still broken.

Please correct me if I have misinterpreted what you are askingl; I am not currently monitoring Docker containers anywhere else so cannot replicate those graphs for another device yet, but I can make a plan to do so if needed.

That’s fine, I thought you meant you had other hosts which had working docker container graphs in full

Ah no my apologies if I gave that impression. I am willing to try spinning this up on another host or asking my friend to run through the same exercises and provide his output if that will help (and if he is willing).

1 Like

Hi @laf

I spun up a new machine today, installed Docker and created a new container. Imported into LibreNMS, setup SNMP extend for Docker monitoring - same result.

I gathered the same output you previously asked for and pasted here: Docker-stats.sh troubleshooting - LibreNMS

Does anyone have any insight or ideas on how to proceed/resolve this?

Bump - any ideas?