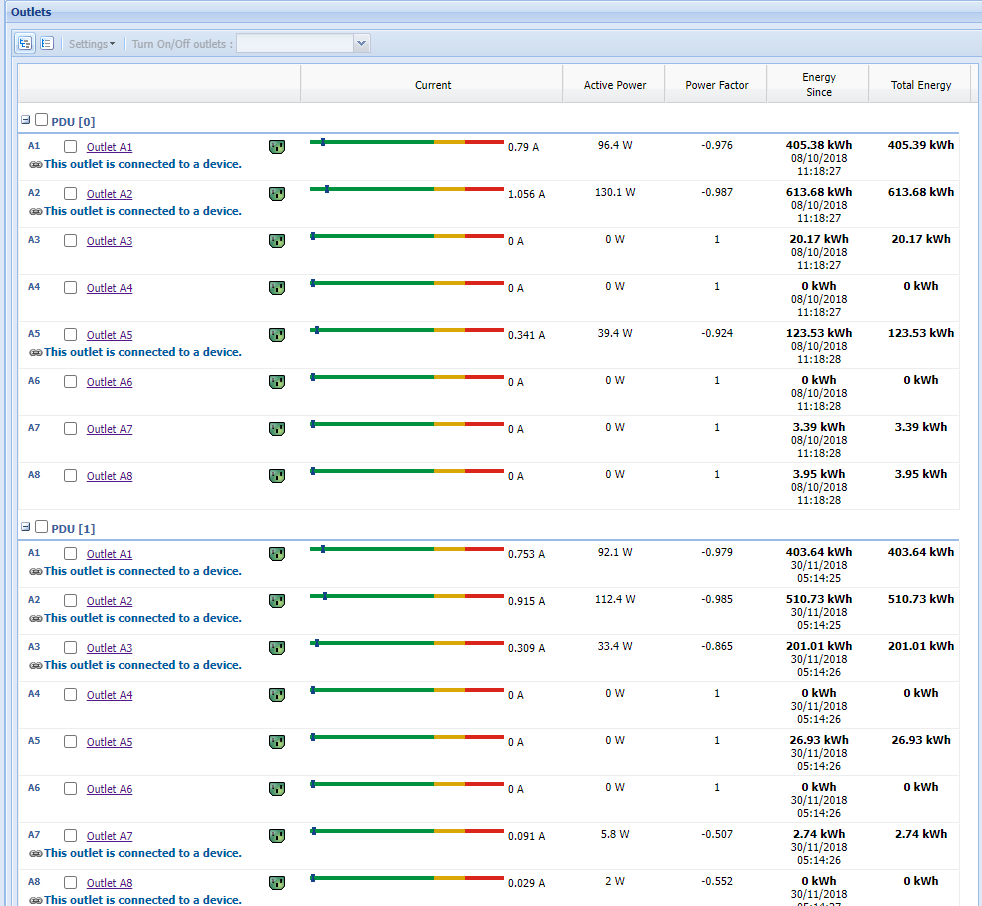
I have a pair of Eaton G3 PDU’s, model EMA111-10. They only show current measurements. There is a “power” item on the dashboard, but it has a broken image icon like it doesn’t exist…
pastebin for discover: LibreNMS DiscoverySQL[select `migration` from `migrations` order by `id` des - Pastebin.com
pastebin for poller: LibreNMS PollerSQL[select `migration` from `migrations` order by `id` desc l - Pastebin.com
output of validate:
./validate.php
====================================
Component | Version
--------- | -------
LibreNMS  | 22.7.0
DB Schema | 2022_07_19_081224_plugins_unique_index (243)
PHP       | 8.0.21
Python    | 3.10.4
MySQL     | 10.8.3-MariaDB-log
RRDTool   | 1.7.2
SNMP      | 5.9.3
====================================

[OK]    Installed from package; no Composer required
[OK]    Database connection successful
[OK]    Database Schema is current
[OK]    SQL Server meets minimum requirements
[OK]    lower_case_table_names is enabled
[OK]    MySQL engine is optimal
[OK]
[OK]    Database schema correct
[OK]    MySQl and PHP time match
[OK]    Connected to rrdcached
[INFO]  Detected Dispatcher Service
[FAIL]  Dispatcher service is enabled on your cluster, but not in use on this node
[WARN]  IPv6 is disabled on your server, you will not be able to add IPv6 devices.
[OK]    rrdtool version ok
[OK]    Connected to rrdcached
[WARN]  Non-git install, updates are manual or from package
If i look in the discovery and search for “voltage” i dont see anything. Do i need to have a module/service/application enabled to get this? I find it hard to believe that a well known PDU like an Eaton only outputs current and nothing else over snmp:
Here’s the broken image:
thanks!