Error Drawing Graphs / Red Graphs

I am working on setting up a new instance of LibreNMS on CentOS 7 with Nginx. I followed the guide, and added a few devices. The real-time graphs work, but the normal graphs are either red or show “Error Drawing Graph”.

Here is the output of validate.php

[root@itlibrenms librenms]# /opt/librenms/validate.php
====================================
Component | Version
--------- | -------
LibreNMS  | 1.30-38-gd814046
DB Schema | 201
PHP       | 7.0.21
MySQL     | 5.5.52-MariaDB
RRDTool   | 1.4.8
SNMP      | NET-SNMP 5.7.2
====================================

[OK]    Database connection successful
[OK]    Database schema correct

can you take the screen shot of what you are looking at??..also keep in mind if just added the device you won’t see a graph may take up 10 min to the graph.

Click a graph, click show rrd command then paste the output.

Here’s the view of one of the devices. It’s been added for 8+ hours.

Here is the graph output:

RRDTool Command

rrdtool graph /tmp/tkRkORanhjsDkdGZ  -g --alt-autoscale-max --rigid -E --start 1502200200 --end 1502286600 --width 1219.5 --height 300 -c BACK#EEEEEE00 -c SHADEA#EEEEEE00 -c SHADEB#EEEEEE00 -c FONT#000000 -c CANVAS#FFFFFF00 -c GRID#a5a5a5 -c MGRID#FF9999 -c FRAME#5e5e5e -c ARROW#5e5e5e -R normal --font LEGEND:8:DejaVuSansMono --font AXIS:7:DejaVuSansMono --font-render-mode normal COMMENT:'                   Now       Avg      Max' COMMENT:'\n' CDEF:inB= CDEF:outB= CDEF:octets=inB,outB,+ CDEF:doutB=outB,-1,* CDEF:inbits=inB,8,* CDEF:outbits=outB,8,* CDEF:bits=inbits,outbits,+ CDEF:doutbits=doutB,8,* VDEF:95thin=inbits,95,PERCENT VDEF:95thout=outbits,95,PERCENT CDEF:d95thoutn=doutbits,-1,* VDEF:d95thoutn95=d95thoutn,95,PERCENT CDEF:d95thoutn95n=doutbits,doutbits,-,d95thoutn95,-1,*,+ VDEF:d95thout=d95thoutn95n,FIRST VDEF:totin=inB,TOTAL VDEF:avein=inbits,AVERAGE VDEF:totout=outB,TOTAL VDEF:aveout=outbits,AVERAGE VDEF:tot=octets,TOTAL COMMENT:' \n' HRULE:999999999999999#FFFFFF:'Total     In ' GPRINT:inbits:LAST:%6.2lf%s GPRINT:inbits:AVERAGE:%6.2lf%s GPRINT:inbits:MAX:%6.2lf%s GPRINT:totin:%6.2lf%sB COMMENT:'\n' HRULE:999999999999990#FFFFFF:'          Out' GPRINT:outbits:LAST:%6.2lf%s GPRINT:outbits:AVERAGE:%6.2lf%s GPRINT:outbits:MAX:%6.2lf%s GPRINT:totout:%6.2lf%sB COMMENT:'\n' HRULE:999999999999990#FFFFFF:'          Agg' GPRINT:bits:LAST:%6.2lf%s GPRINT:bits:AVERAGE:%6.2lf%s GPRINT:bits:MAX:%6.2lf%s GPRINT:tot:%6.2lf%sB COMMENT:'\n' HRULE:0#999999

RRDTool Output

ERROR: String ends after the = sign on 'CDEF:inB='

That’s because as right now there is no support …yet for number of clients and number of AP’s on the ArubaOS.

It’s the same result on our Avaya switches. Everything is red or the graphs on network ports don’t show.

This is what I’m getting when we click on a port.

run a ./validate.php again and pastebin the results.

are you running memcache?

I’m not running memcache.

I did upgrade to RRDTool 1.6.0, and things are getting a little better.

Here’s the validate results.
[root@itlibrenms ~]# /opt/librenms/validate.php
====================================
Component | Version
--------- | -------
LibreNMS | 1.30-44-g3ca6f84
DB Schema | 201
PHP | 7.0.21
MySQL | 5.5.52-MariaDB
RRDTool | 1.6.0
SNMP | NET-SNMP 5.7.2
====================================

[OK]    Database connection successful
[OK]    Database schema correct

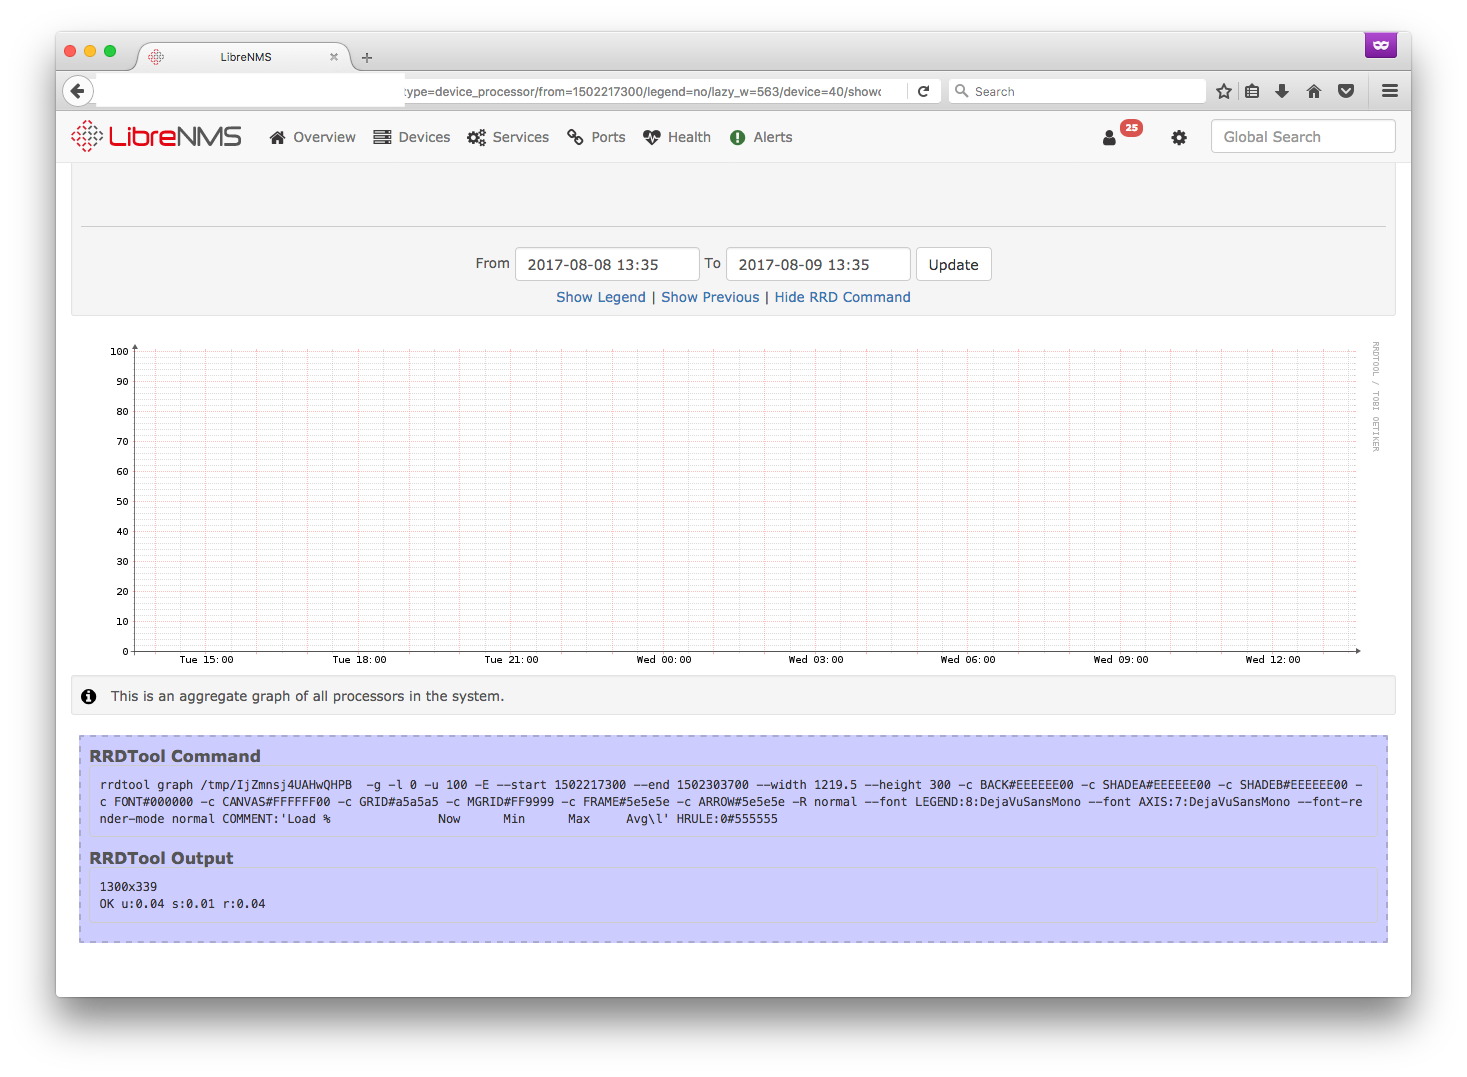
Here’s the new results from the RRD command:
RRDTool Command

rrdtool graph /tmp/v7jZySu1Ii5zT5g7  -g --alt-autoscale-max --rigid -E --start 1502206500 --end 1502292900 --width 1219.5 --height 300 -c BACK#EEEEEE00 -c SHADEA#EEEEEE00 -c SHADEB#EEEEEE00 -c FONT#000000 -c CANVAS#FFFFFF00 -c GRID#a5a5a5 -c MGRID#FF9999 -c FRAME#5e5e5e -c ARROW#5e5e5e -R normal --font LEGEND:8:DejaVuSansMono --font AXIS:7:DejaVuSansMono --font-render-mode normal COMMENT:'                   Now       Avg      Max' COMMENT:'\n' CDEF:inB= CDEF:outB= CDEF:octets=inB,outB,+ CDEF:doutB=outB,-1,* CDEF:inbits=inB,8,* CDEF:outbits=outB,8,* CDEF:bits=inbits,outbits,+ CDEF:doutbits=doutB,8,* VDEF:95thin=inbits,95,PERCENT VDEF:95thout=outbits,95,PERCENT CDEF:d95thoutn=doutbits,-1,* VDEF:d95thoutn95=d95thoutn,95,PERCENT CDEF:d95thoutn95n=doutbits,doutbits,-,d95thoutn95,-1,*,+ VDEF:d95thout=d95thoutn95n,FIRST VDEF:totin=inB,TOTAL VDEF:avein=inbits,AVERAGE VDEF:totout=outB,TOTAL VDEF:aveout=outbits,AVERAGE VDEF:tot=octets,TOTAL COMMENT:' \n' HRULE:999999999999999#FFFFFF:'Total     In ' GPRINT:inbits:LAST:%6.2lf%s GPRINT:inbits:AVERAGE:%6.2lf%s GPRINT:inbits:MAX:%6.2lf%s GPRINT:totin:%6.2lf%sB COMMENT:'\n' HRULE:999999999999990#FFFFFF:'          Out' GPRINT:outbits:LAST:%6.2lf%s GPRINT:outbits:AVERAGE:%6.2lf%s GPRINT:outbits:MAX:%6.2lf%s GPRINT:totout:%6.2lf%sB COMMENT:'\n' HRULE:999999999999990#FFFFFF:'          Agg' GPRINT:bits:LAST:%6.2lf%s GPRINT:bits:AVERAGE:%6.2lf%s GPRINT:bits:MAX:%6.2lf%s GPRINT:tot:%6.2lf%sB COMMENT:'\n' HRULE:0#999999

RRDTool Output

ERROR: can not parse an empty rpn expression

what distro of Linux are you using?

I’m using CentOS 7.

How did you get RRD tool version 1.6.0 on centos 7? I remember while back we had a guy with the same issue when tried to update rrdtool. If remember correctly once he downgraded back 1.4.8 everything started working again.

I grabbed the RPM from the OpenNMS project, and it installed. Interestingly, if I check the management processor of a Palo Alto Firewall, the graph appears and RRDTool appears to generate the data, but nothing appears on the graph.

That’s exactly what that guy did was install from OpenNMS repo and caused these exact same problems. I recommend going back to 1.4.8.

1 Like

I’ve downgraded to 1.4.8, restarted, and I’m back to this error:

RRDTool Command
rrdtool graph /tmp/SHTJRwp3RCTukCXi  -g --alt-autoscale-max --rigid -E --start 1502218800 --end 1502305200 --width 1404 --height 307 -c BACK#EEEEEE00 -c SHADEA#EEEEEE00 -c SHADEB#EEEEEE00 -c FONT#000000 -c CANVAS#FFFFFF00 -c GRID#a5a5a5 -c MGRID#FF9999 -c FRAME#5e5e5e -c ARROW#5e5e5e -R normal --font LEGEND:8:DejaVuSansMono --font AXIS:7:DejaVuSansMono --font-render-mode normal COMMENT:'                   Now       Avg      Max' COMMENT:'\n' CDEF:inB= CDEF:outB= CDEF:octets=inB,outB,+ CDEF:doutB=outB,-1,* CDEF:inbits=inB,8,* CDEF:outbits=outB,8,* CDEF:bits=inbits,outbits,+ CDEF:doutbits=doutB,8,* VDEF:95thin=inbits,95,PERCENT VDEF:95thout=outbits,95,PERCENT CDEF:d95thoutn=doutbits,-1,* VDEF:d95thoutn95=d95thoutn,95,PERCENT CDEF:d95thoutn95n=doutbits,doutbits,-,d95thoutn95,-1,*,+ VDEF:d95thout=d95thoutn95n,FIRST VDEF:totin=inB,TOTAL VDEF:avein=inbits,AVERAGE VDEF:totout=outB,TOTAL VDEF:aveout=outbits,AVERAGE VDEF:tot=octets,TOTAL COMMENT:' \n' HRULE:999999999999999#FFFFFF:'Total     In ' GPRINT:inbits:LAST:%6.2lf%s GPRINT:inbits:AVERAGE:%6.2lf%s GPRINT:inbits:MAX:%6.2lf%s GPRINT:totin:%6.2lf%sB COMMENT:'\n' HRULE:999999999999990#FFFFFF:'          Out' GPRINT:outbits:LAST:%6.2lf%s GPRINT:outbits:AVERAGE:%6.2lf%s GPRINT:outbits:MAX:%6.2lf%s GPRINT:totout:%6.2lf%sB COMMENT:'\n' HRULE:999999999999990#FFFFFF:'          Agg' GPRINT:bits:LAST:%6.2lf%s GPRINT:bits:AVERAGE:%6.2lf%s GPRINT:bits:MAX:%6.2lf%s GPRINT:tot:%6.2lf%sB COMMENT:'\n' HRULE:0#999999

RRDTool Output
ERROR: String ends after the = sign on 'CDEF:inB='

did enable rrdcached? http://docs.librenms.org/Extensions/RRDCached/

Those outputs for rrd commands contain no rrd files so you have something utterly broken.

Post the output of:

./discovery.php -h HOSTNAME -d
./poller.php -h HOSTNAME -d
1 Like

This all started because a previous instance of LibreNMS crapped out on me, but in the course of trying to figure out what’s wrong with this instance, I was able to go back to the previous instance and fix what was broken after an update.