Hi guys,
I have two probles when i adding some Dell server with iDrac interface.
I can’t see two graphs: Overall Traffic and Processor Usage.
For Overall Traffic i see this string “ERROR: String ends after the = sign on ‘CDEF:inB=’” instead of graph and for Processor Usage, i see the string “No processor” instead of graph.
daily.sh and validate.php executions show all green (no errors).
Can anyone help me? Thanks in advance!
(daily.sh and validate.php exec.)
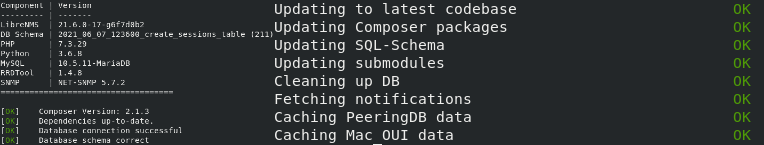
(RRDTool ver: 1.4.8)