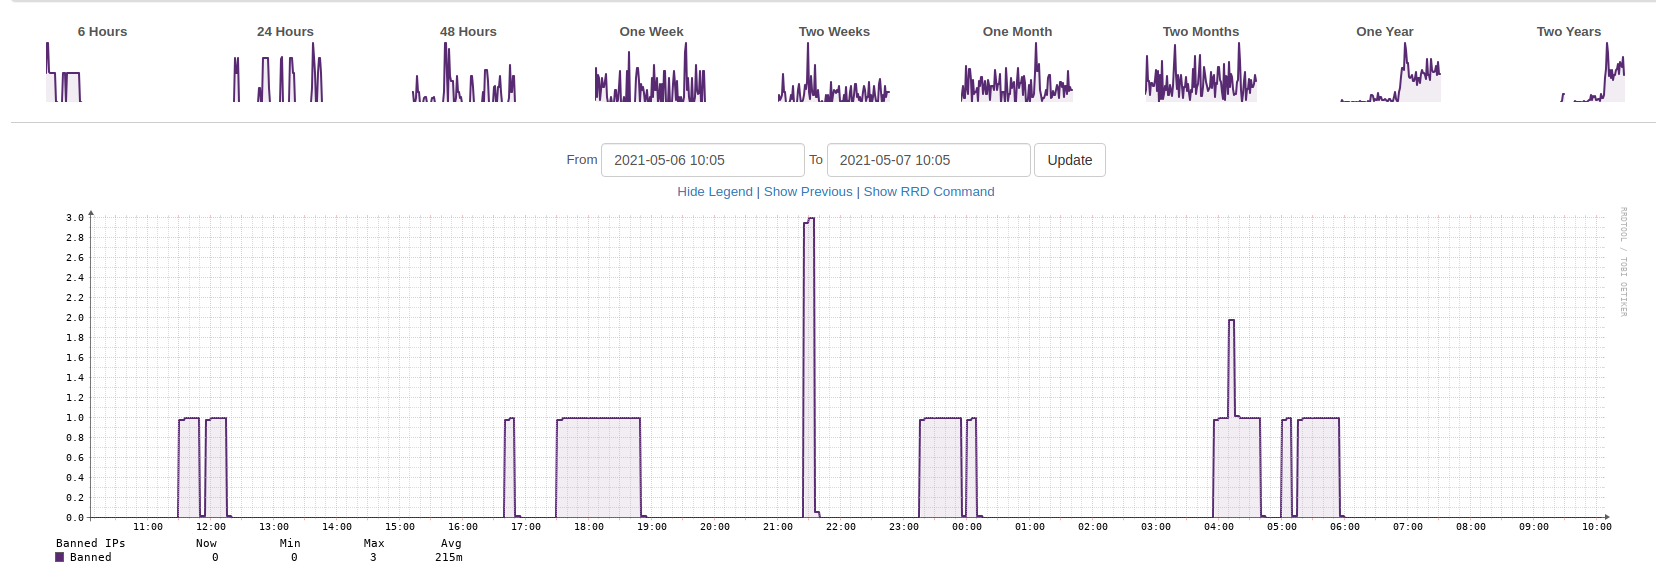
Trying to monitor Fail2Ban on a Ubuntu 20.04.2 LTS system. This is how it looks in the web ui:

This is how my other Debian server looks:
Running script manually on server seems to give proper output
$ sudo -u Debian-snmp sudo /etc/snmp/fail2ban
{“data”:{“jails”:{“sshd”:“0”},“total”:0},“error”:“0”,“errorString”:“fail2ban-client exited with 0”,“version”:“1”}
Any help on how to fix would be greatly appreciated.
edit.
I noticed the output from running the script on the Debian server is different
$ sudo -u Debian-snmp sudo /etc/snmp/fail2ban
{“version”:“1”,“errorString”:“fail2ban-client exited with 0”,“error”:“0”,“data”:{“jails”:{“sshd”:“0”},“total”:0}}